 Vigia Studio
Live dashboards
for Nintex K2
User guide
Design a dashboard from a template, set up its blocks, restrict it to a K2 folder and deploy it in K2 as a form.
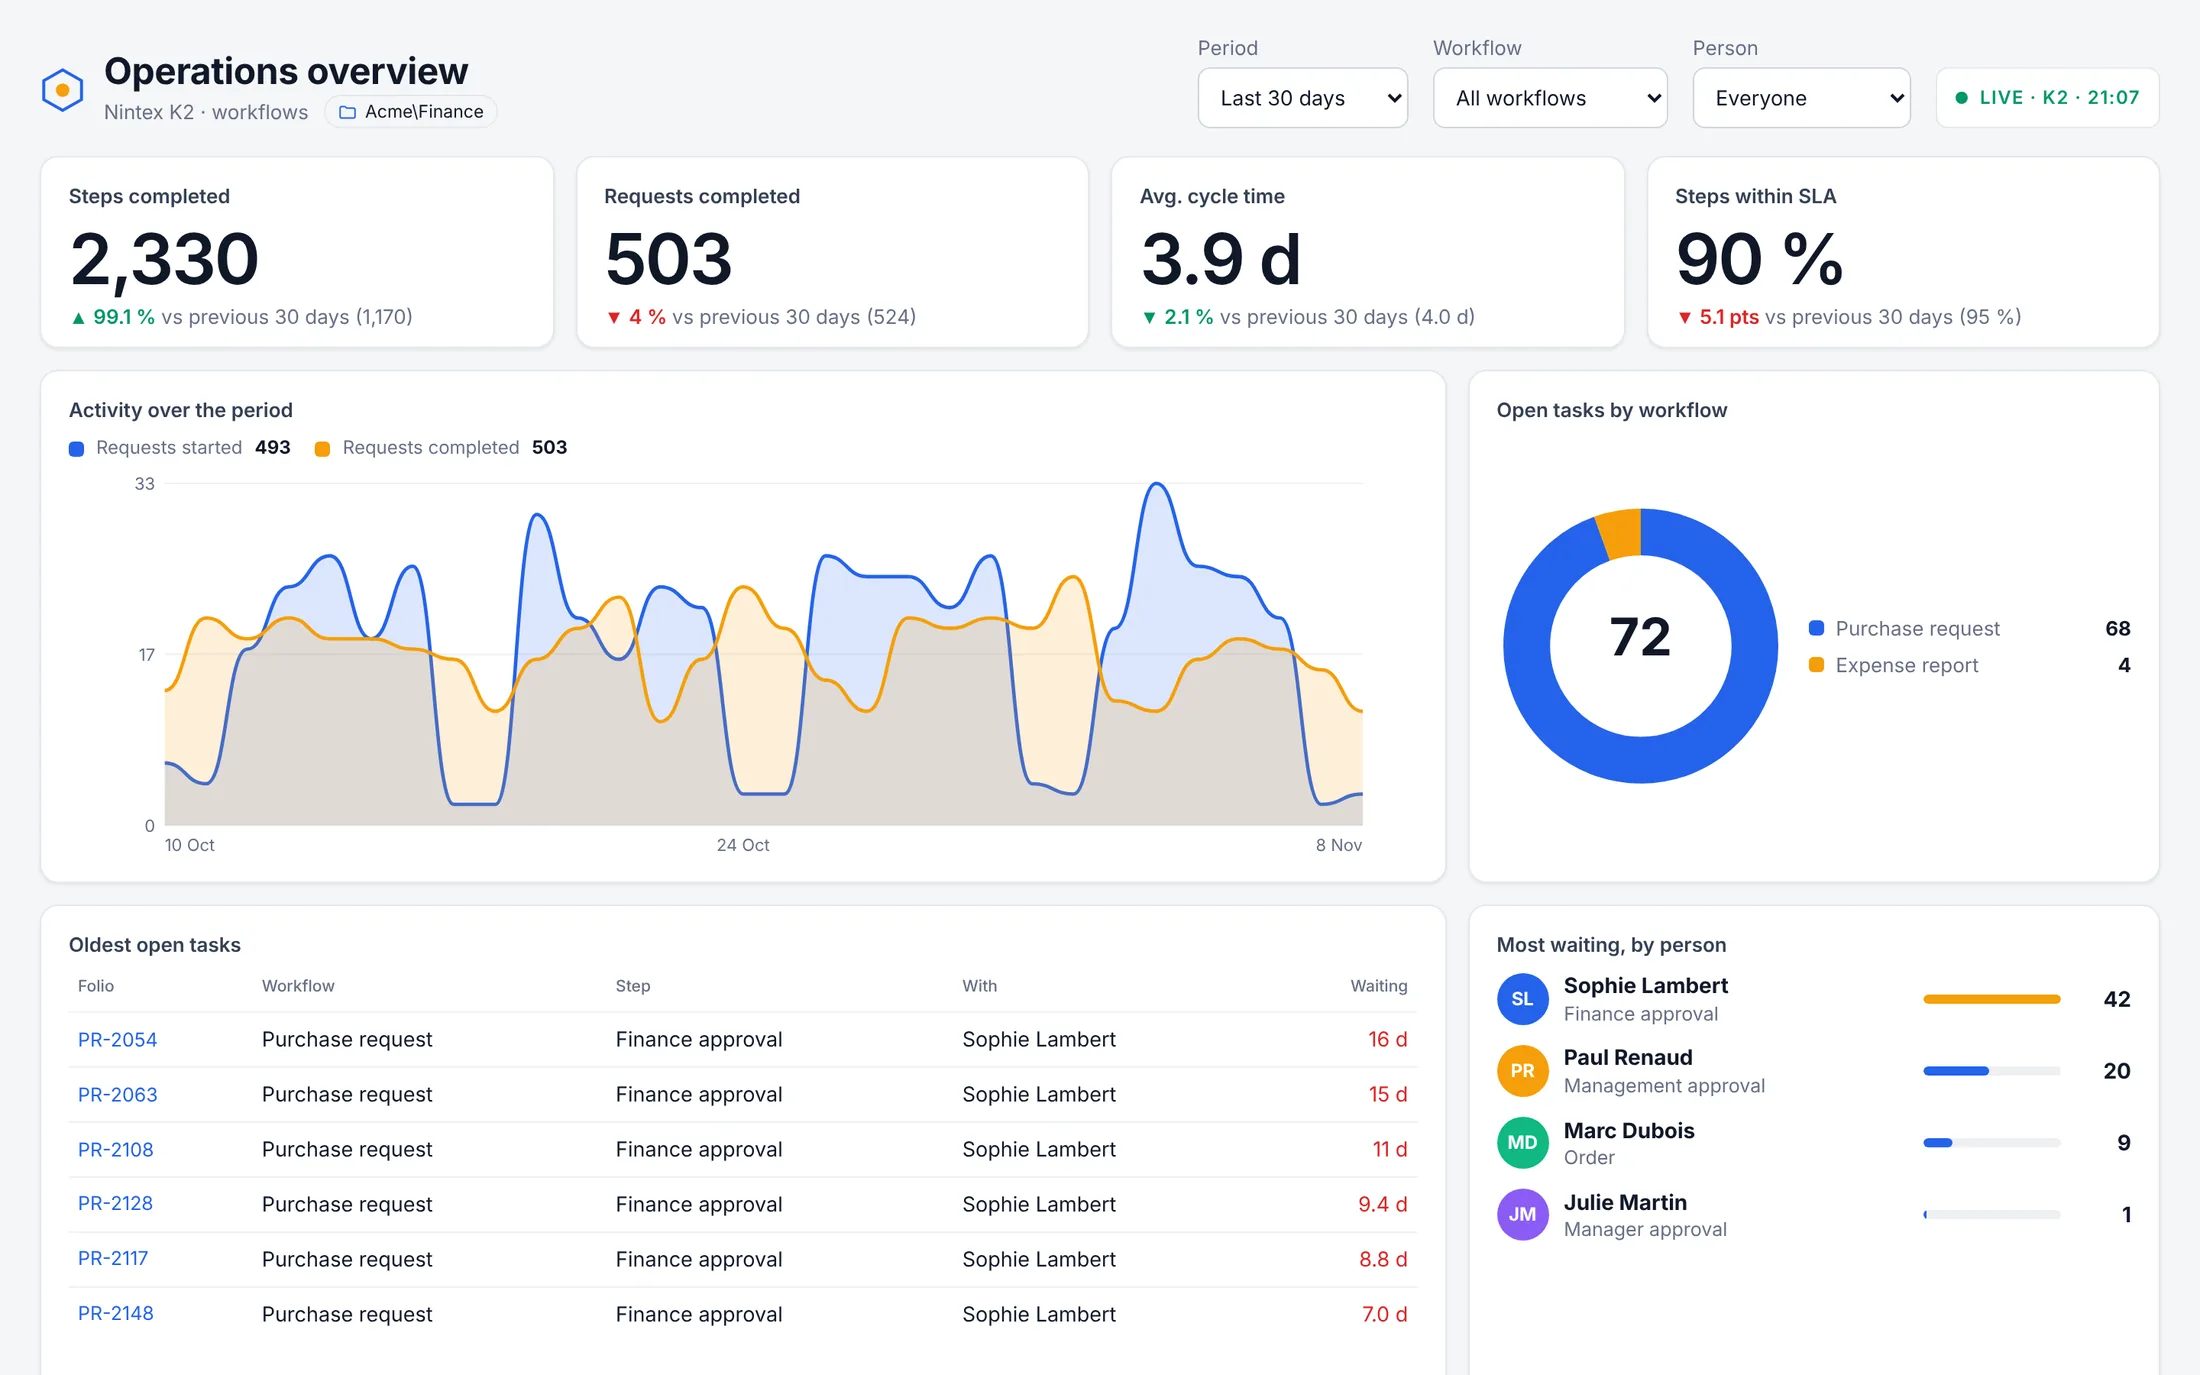
Contents
- Before you startK2 requirements
- Create a dashboardAccount and templates
- Arrange the blocksThe editor
- Set up each blockData, grouping, colors
- The 43 blocksWhat each block shows
- The valuesWhat each number means
- Dashboard settingsLook, filters, K2 folder
- Designing a good dashboardMethod and layouts
- Deploy in K2Package and parameters
- Data and securityWhat is read, by whom
- TroubleshootingMessages and fixes
01Before you start
Vigia Studio builds a dashboard on the data K2 already records about your workflows. You design it in the Studio with sample data, then download one K2 package. Once deployed, the dashboard is a K2 form: people open it in K2 and see live numbers.
What you need in K2
- SmartObject OData enabled in K2 Management › Integration › APIs.
- The workflow reporting SmartObjects published in OData:
Process Instance(requests),Activity Instance Destination(open tasks and decisions) andActivity Instance(steps);Process Set(deployed workflows) is optional. Vigia finds them by name, in the Workflow Reports category or in the Workflow Analytics category (…AnalyticsProcessInstance,…AnalyticsActivityInstanceDestination,…AnalyticsActivityInstance,…AnalyticsProcessSet). You can also give their entity-set names. - The Workflow REST API enabled. It gives the signed-in person's own tasks (block “My tasks”, and a fallback when the worklist SmartObject is missing).
- The right to deploy a package (K2 Management › Packages, or the Deploy-Package command).
Which SmartObject feeds what
| SmartObject (Workflow Analytics) | Data in Vigia | If it is not published |
|---|---|---|
| Process Instance | Requests: started, completed, cycle time, status, originator. | Request blocks say which SmartObject to publish. |
| Activity Instance Destination | Open tasks (no finish date) and decisions (Final_Action). | The signed-in person's own tasks are used. |
| Activity Instance | Steps: pipeline, step durations, steps on time. | Step blocks say which SmartObject to publish. |
| Process Set | Workflows deployed (catalogue, workflow filter). | Workflows are taken from the requests. |
| Event Instance | Events, human or automated; automated share. K2 lists the server events only when they are included in its reporting; otherwise the automated share is 0. | Event blocks say which SmartObject to publish. |
| Task | Actions of people (ActionName, Actioner). | Used as decisions only when Final_Action is missing. |
| Process Overview | Workflow bubbles, since deployment. | Calculated from the period's requests. |
| User Overview | Team scorecard (completes the open tasks). | Calculated from the tasks and steps. Ignored when the dashboard is limited to a K2 folder. |
| Workflow Status | Status by workflow. | Calculated from the period's requests. |
| IPC Details | Sub-workflow map, sub-workflows started. | The map says which SmartObject to publish. |
| Process Data Audit | Data values, data changes feed, data changes. | Data blocks say which SmartObject to publish. |
$metadata to know each SmartObject's fields. It builds the workflow name from Folder and ProcessName when there is no full name, takes the workflow of a step from its request and the person from the task, and reads the decision of each completed task in Final_Action.Words used in this guide
| Word | Meaning |
|---|---|
| Request | One workflow instance (a purchase request, a leave request…). |
| Step | One activity of a request, once it has been done. |
| Decision | The action chosen on a completed task (Approve, Reject, Send back…). |
| Open task | A task waiting in someone's worklist right now. |
| Late | An open task older than the late threshold you set (72 hours by default). The same threshold says whether a step was done on time. |
| Period | The time window of the dashboard: last 7, 30 or 90 days, or 12 months. Open tasks do not depend on it: they are the present state. |
02Create a dashboard
Open ai.fluxcaster.com/vigia/studio and create an account with your name, email and a password. A Helvia Studio account works too.
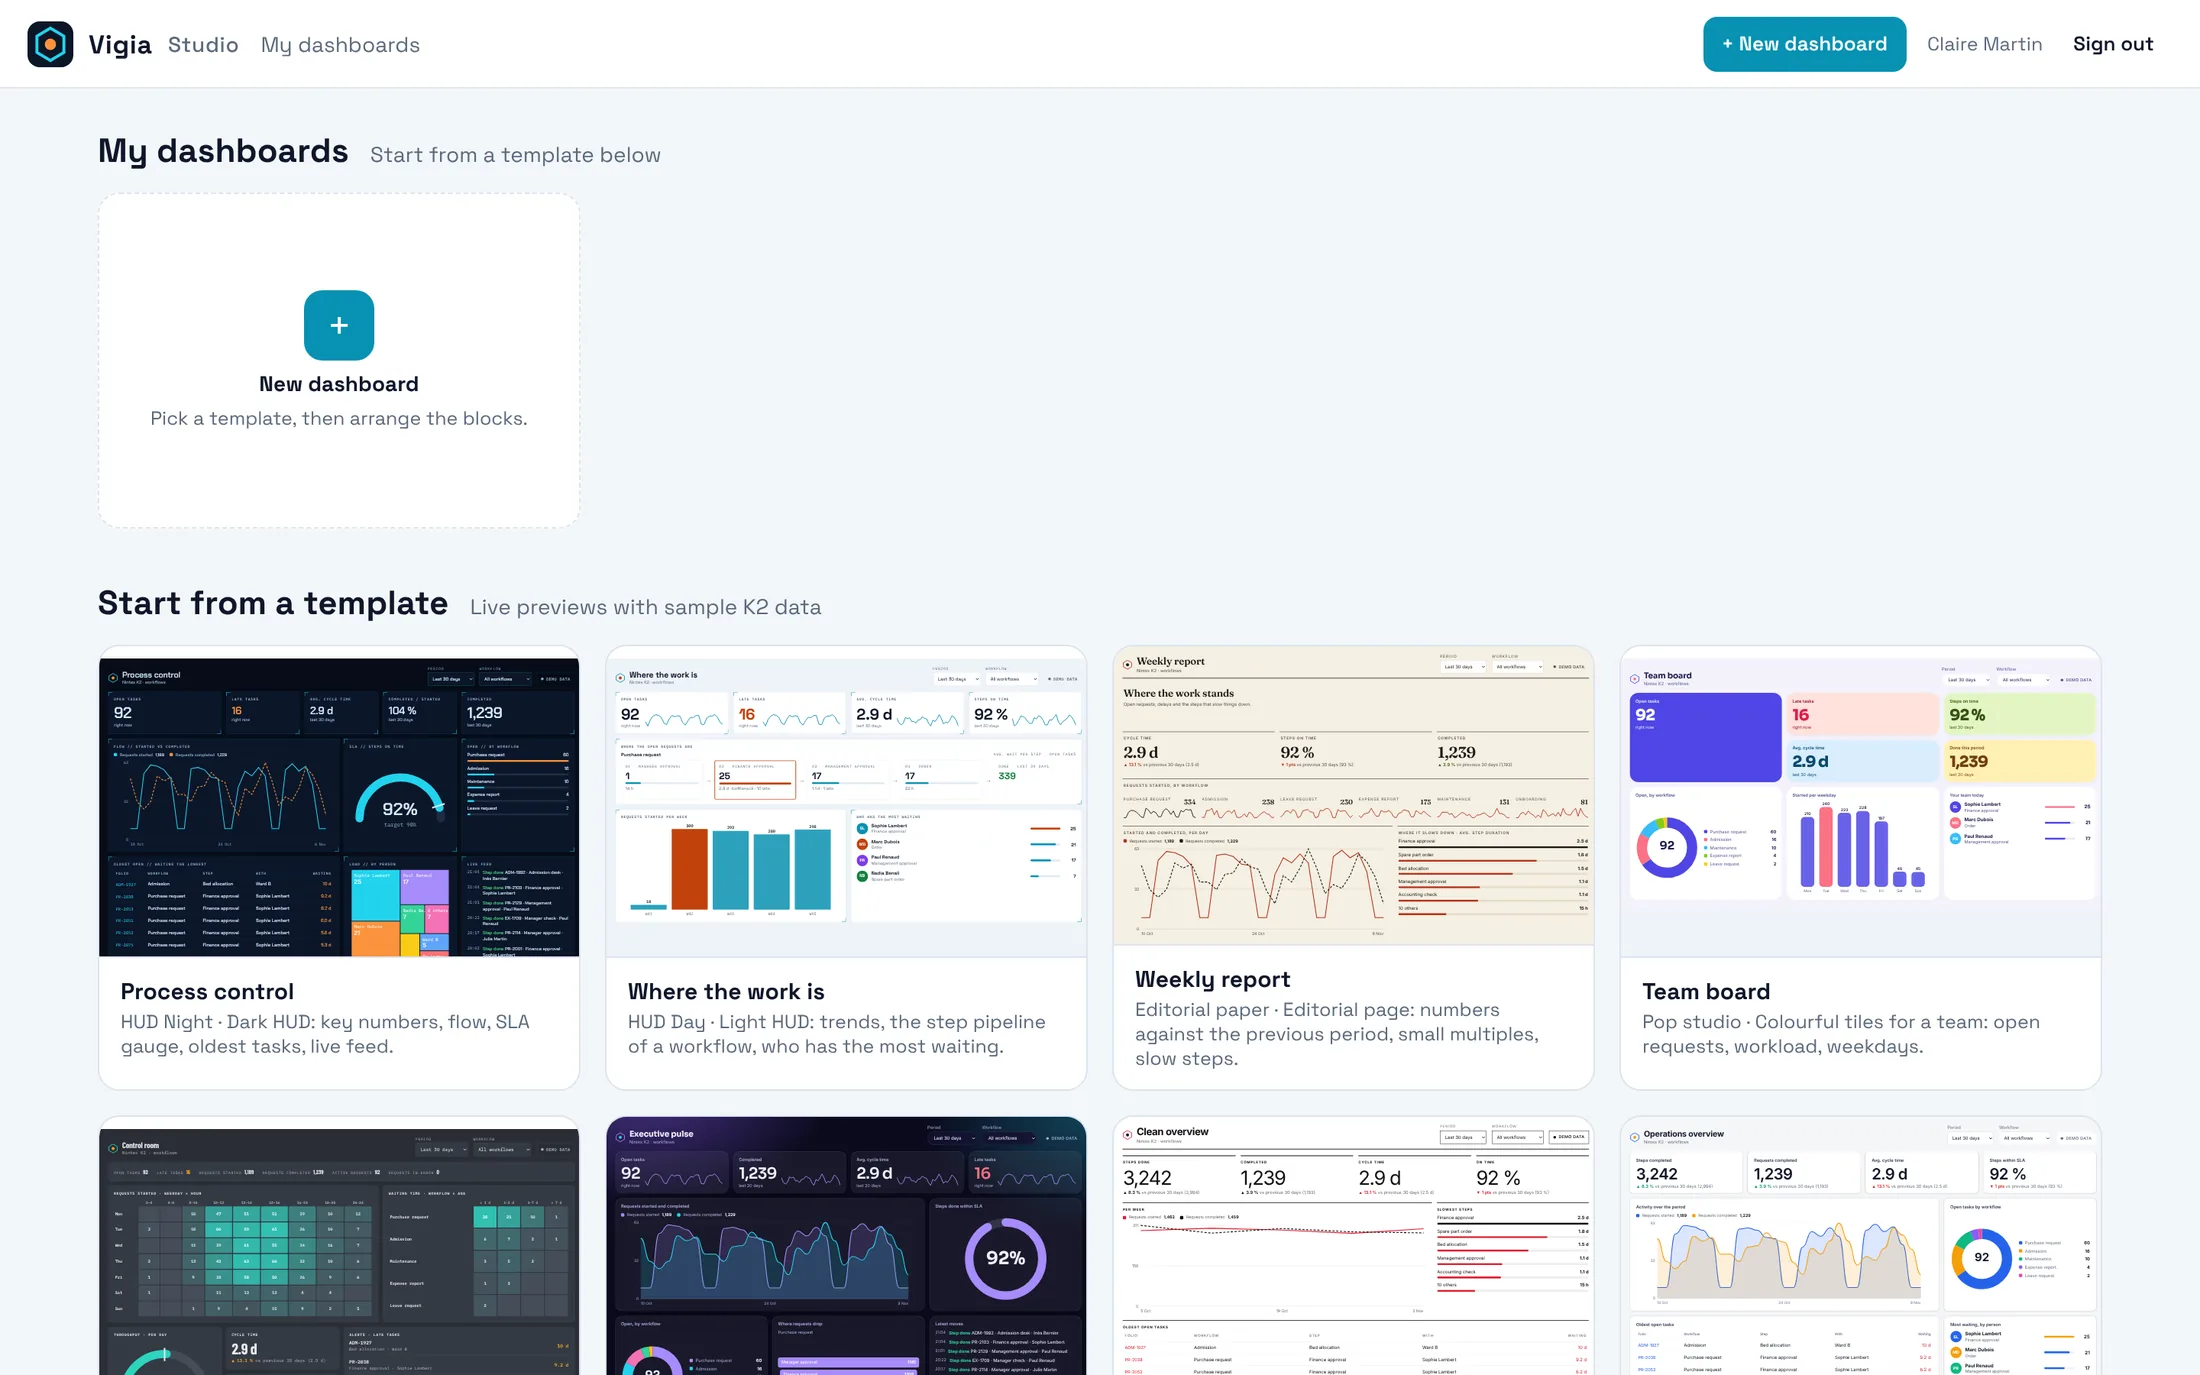
- Click a template, or + New dashboard.
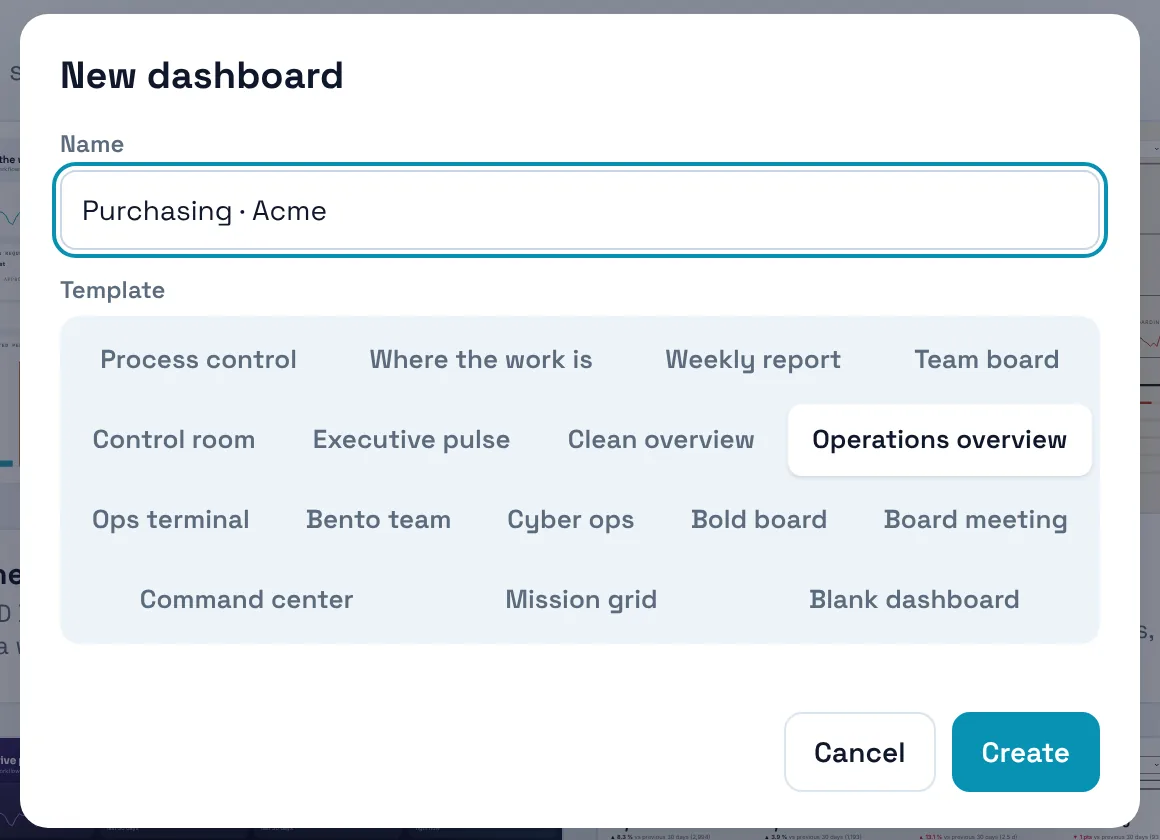
- Give the dashboard a name. You can still change the template in the dialog.
- Click Create: the editor opens with the template's blocks already in place.
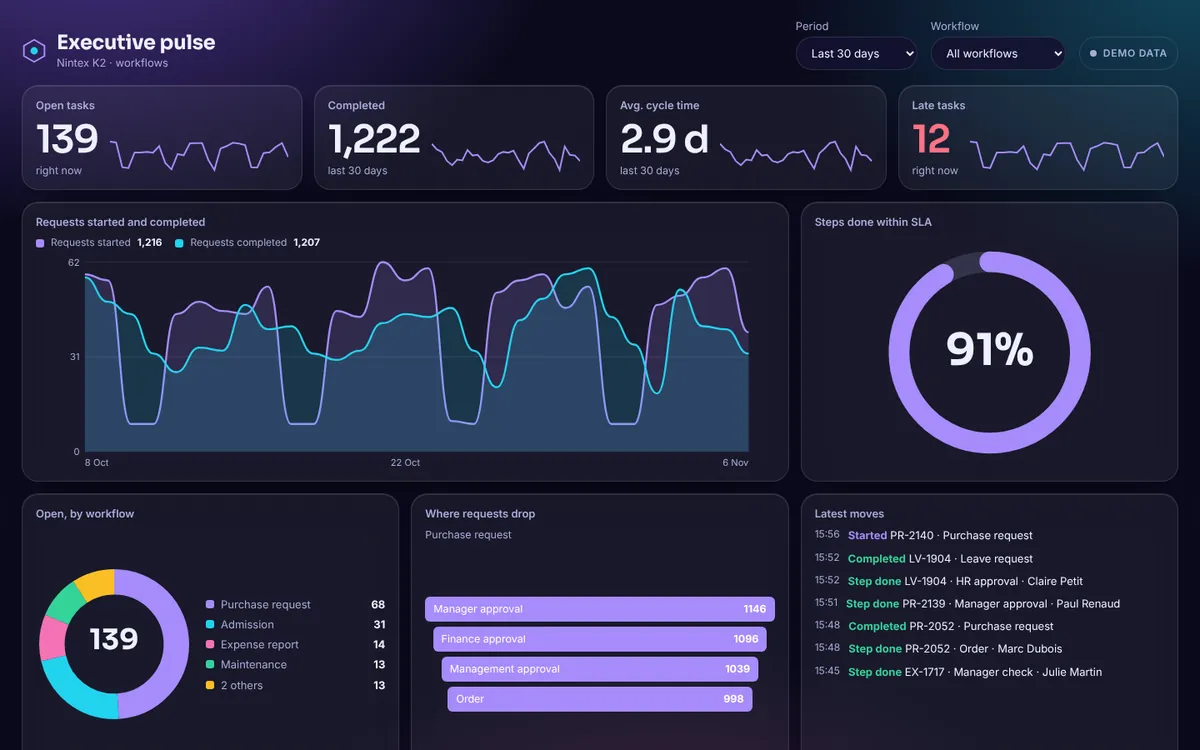
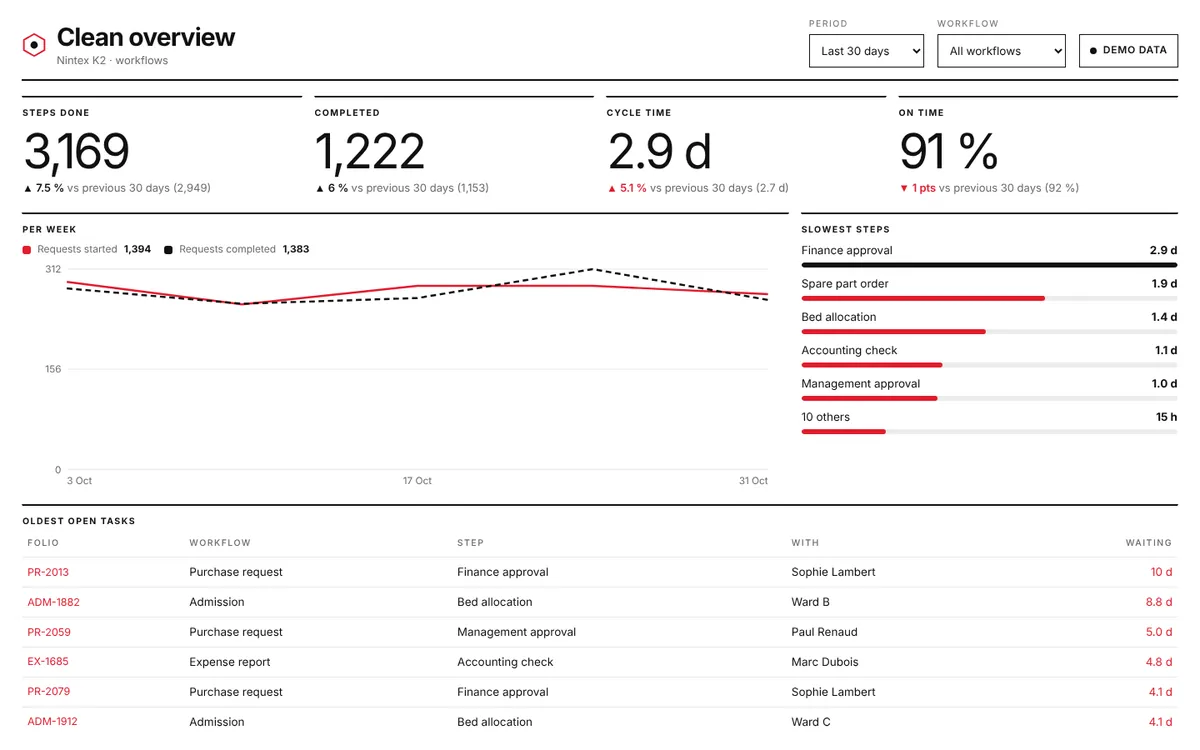
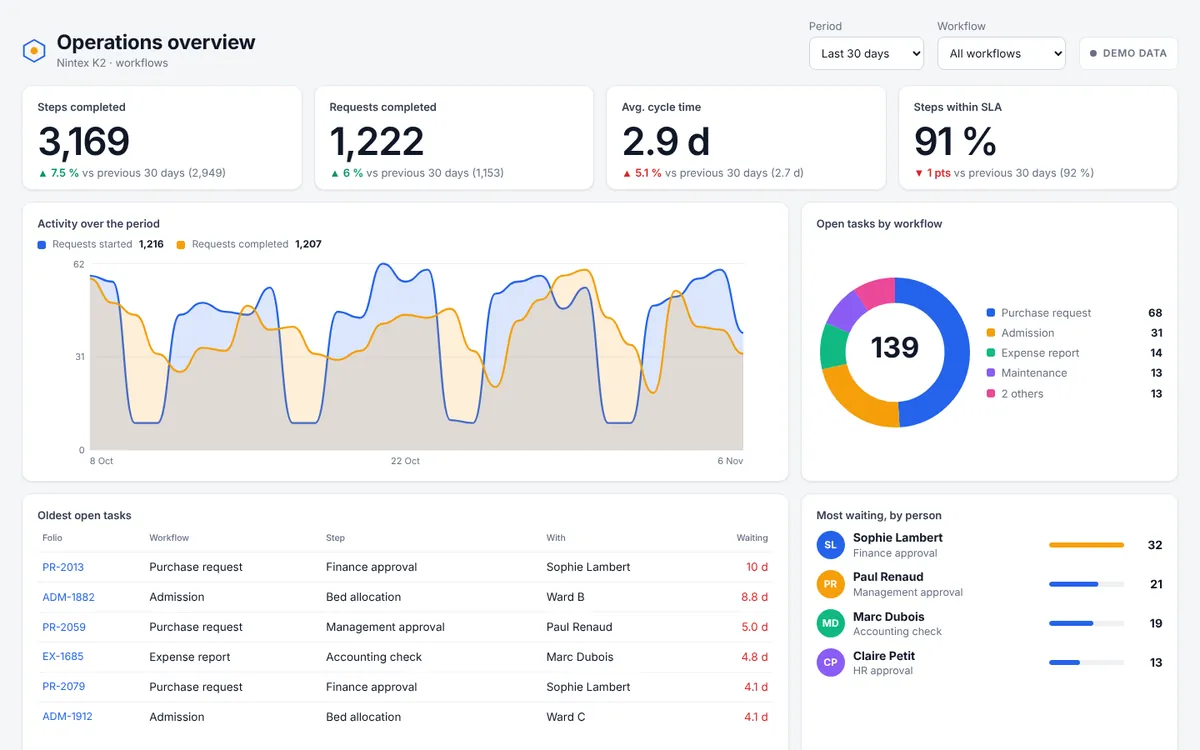
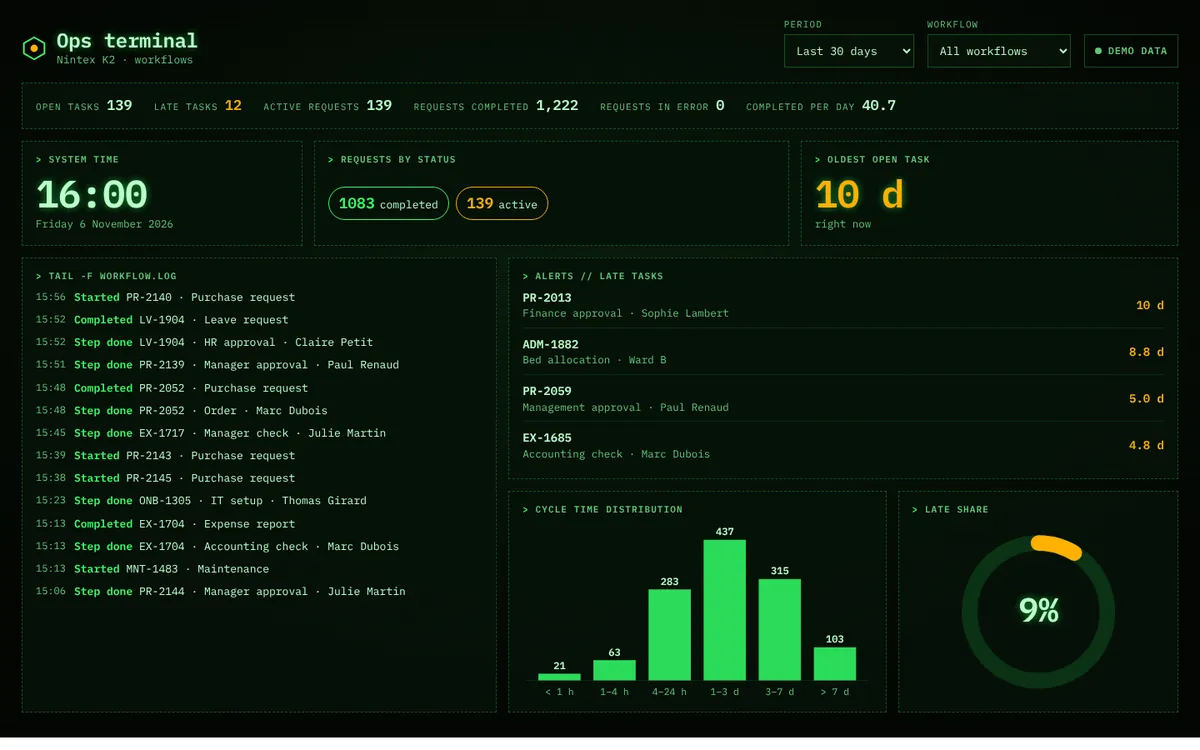
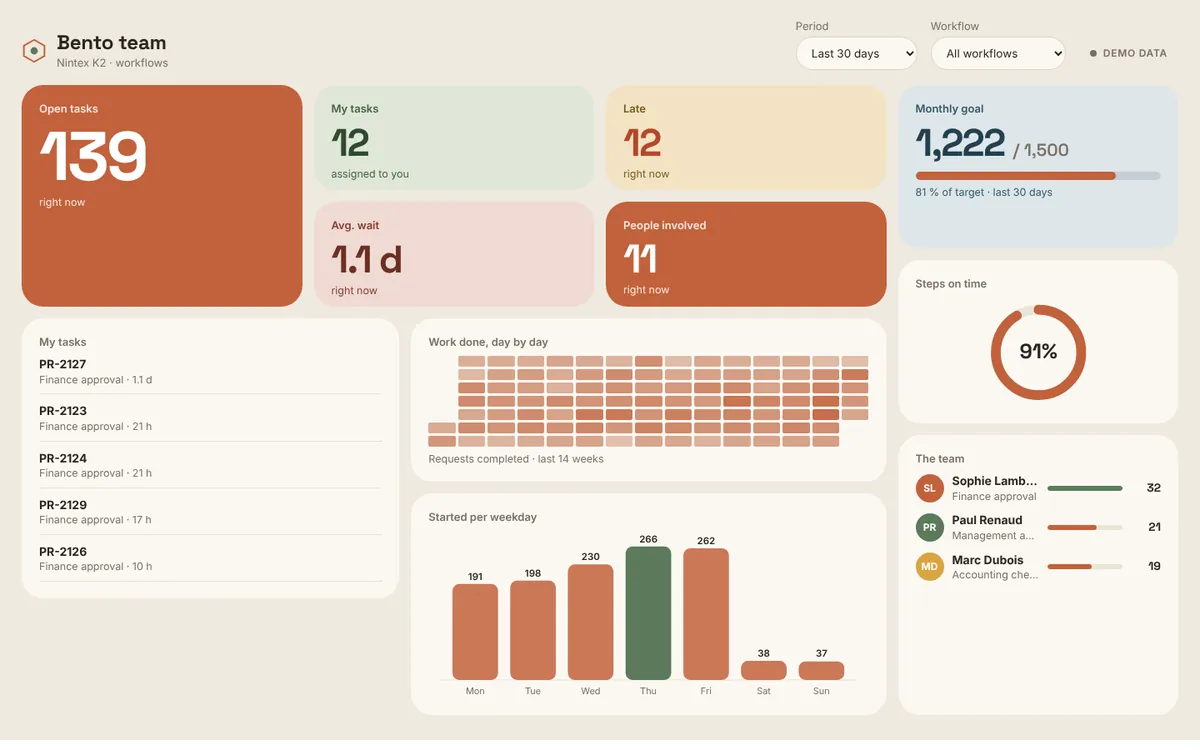
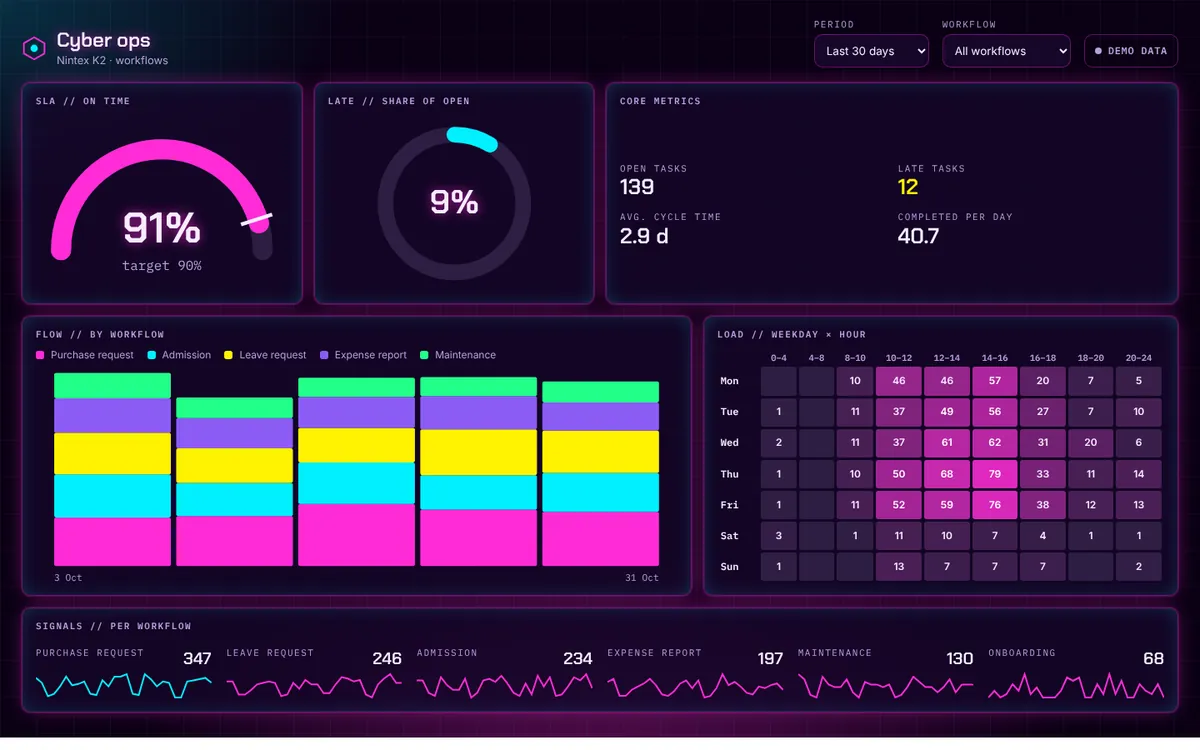
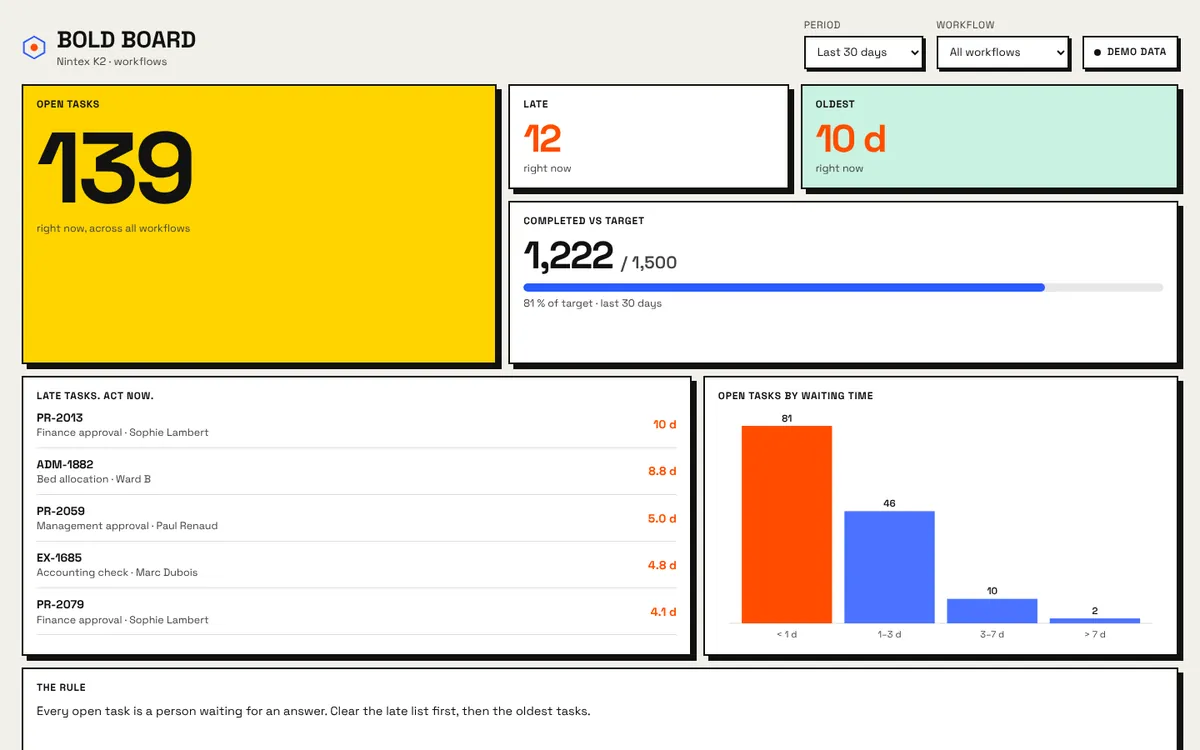
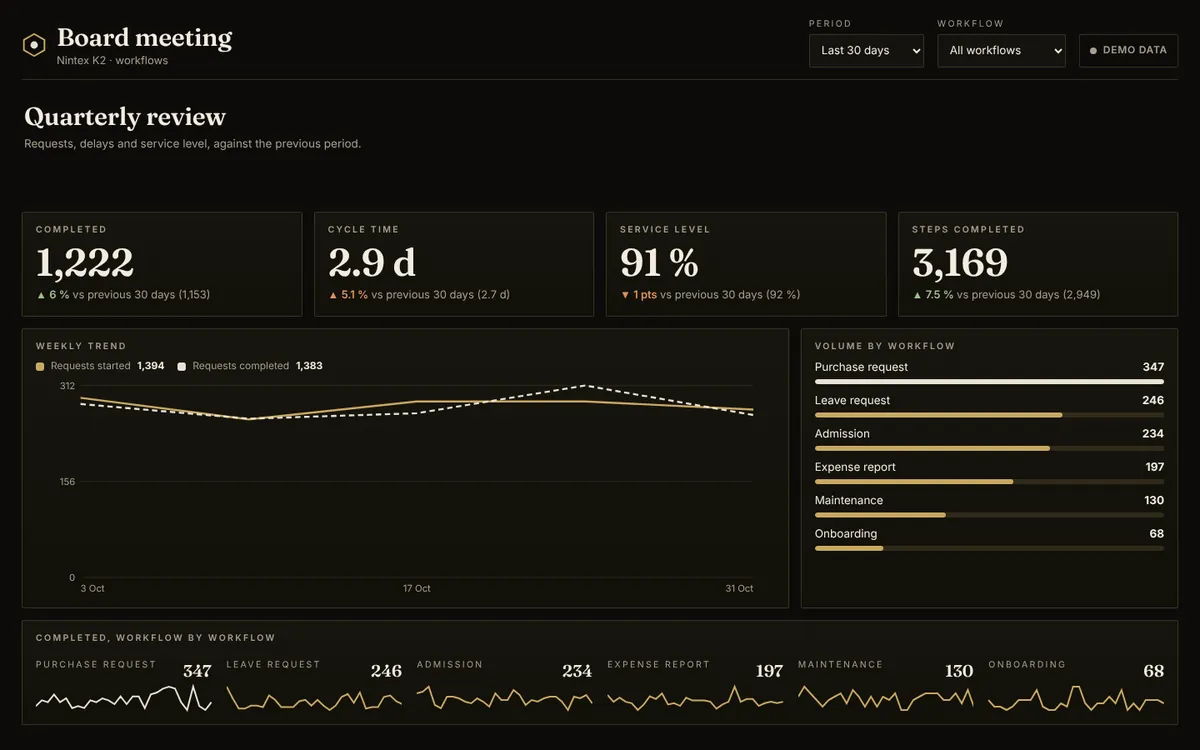
Which template?
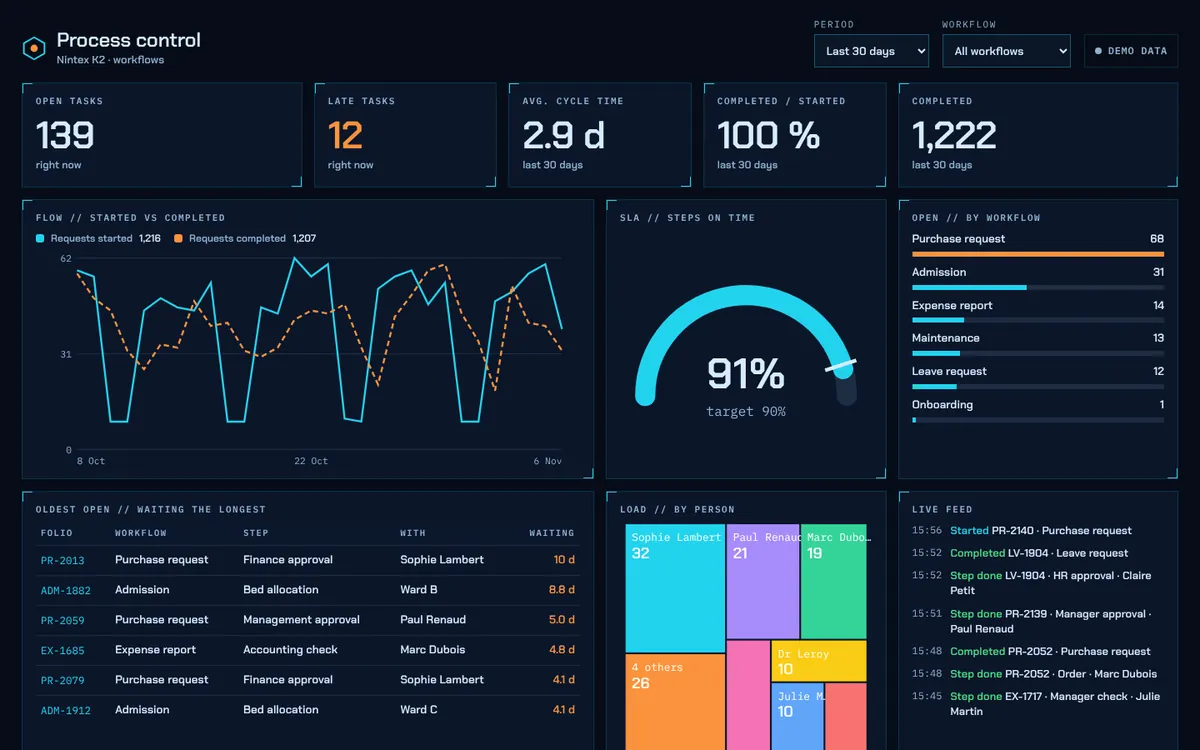
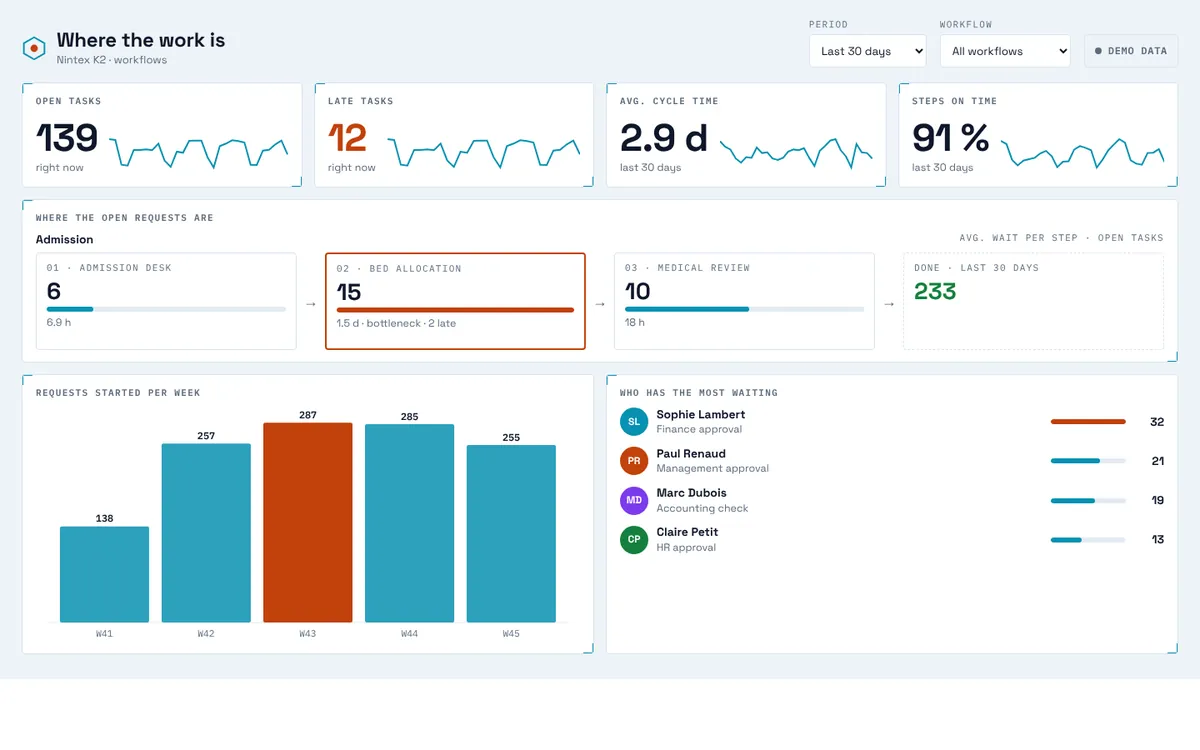
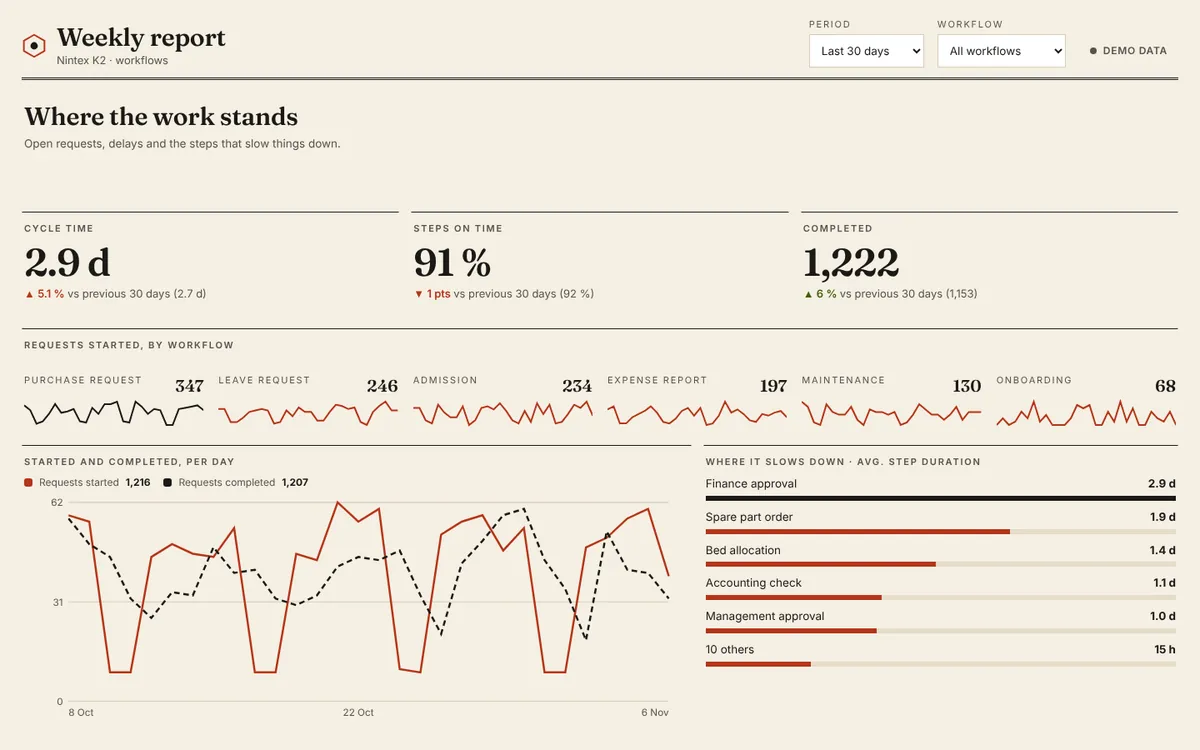
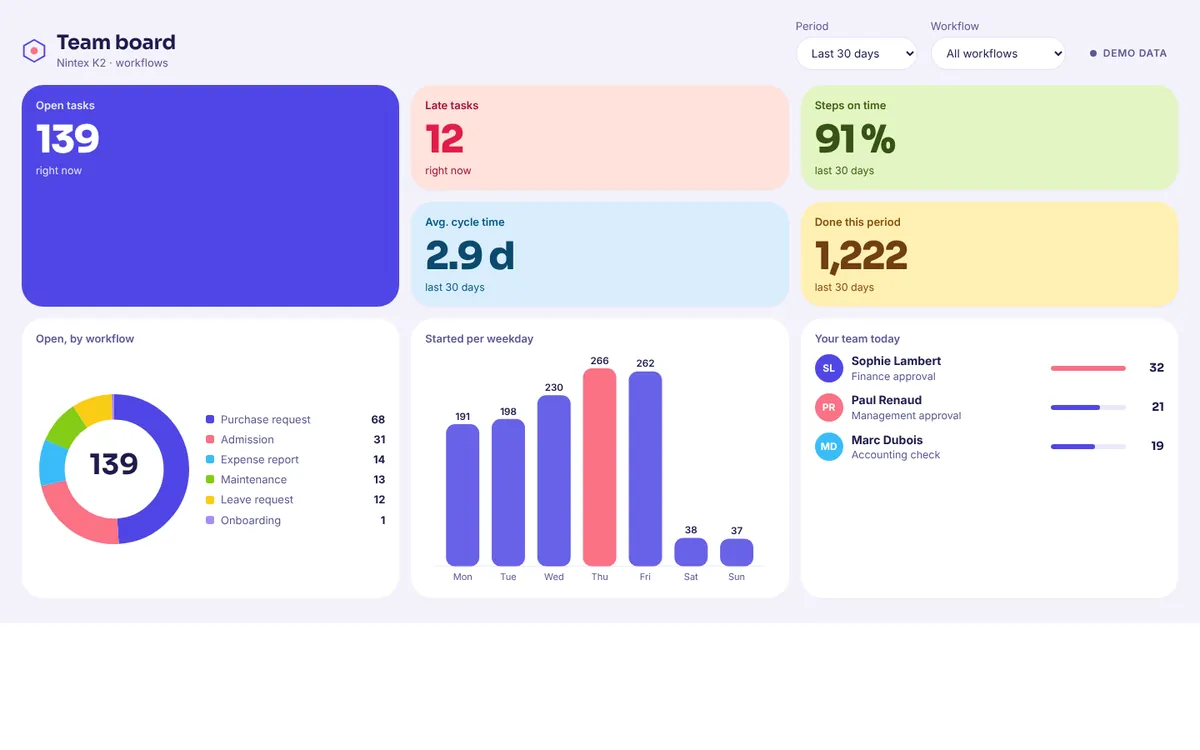
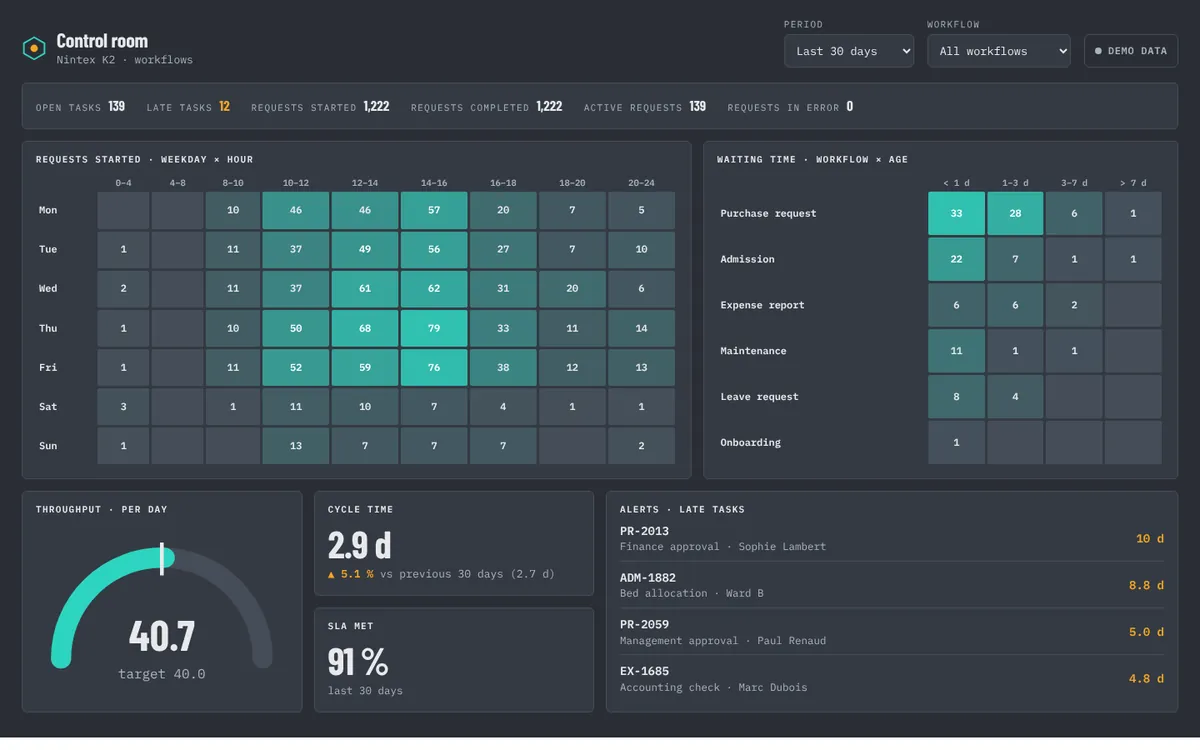
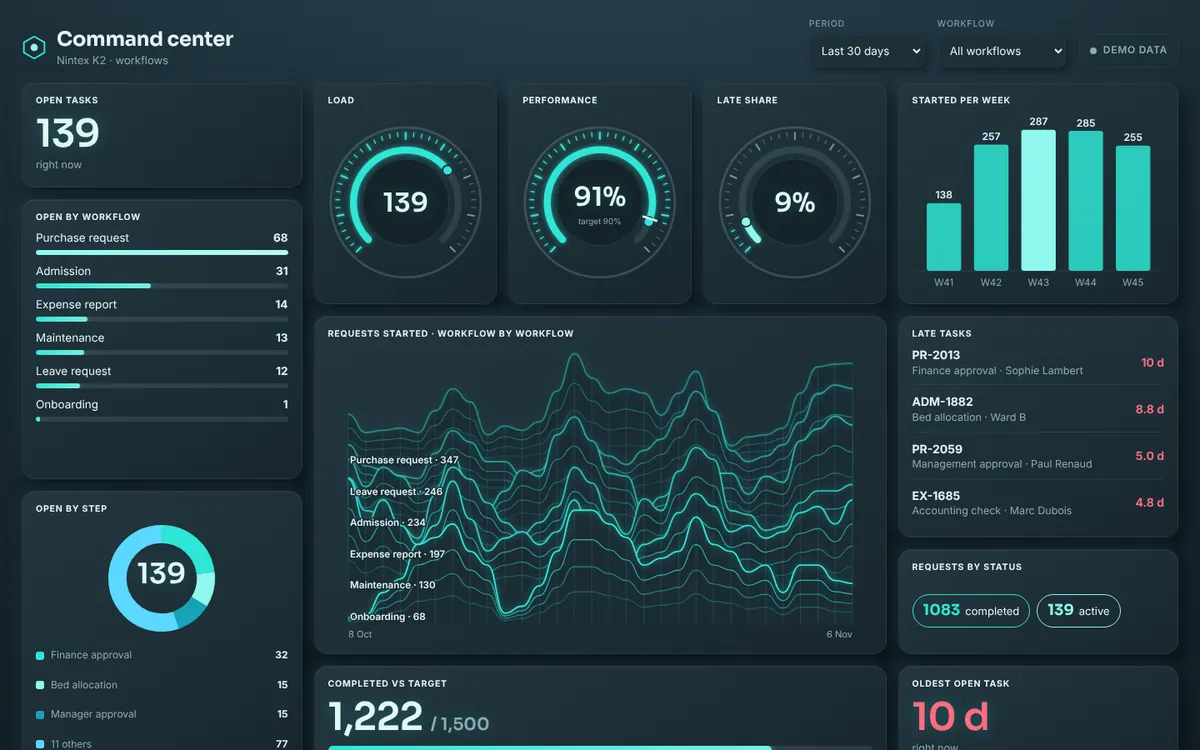
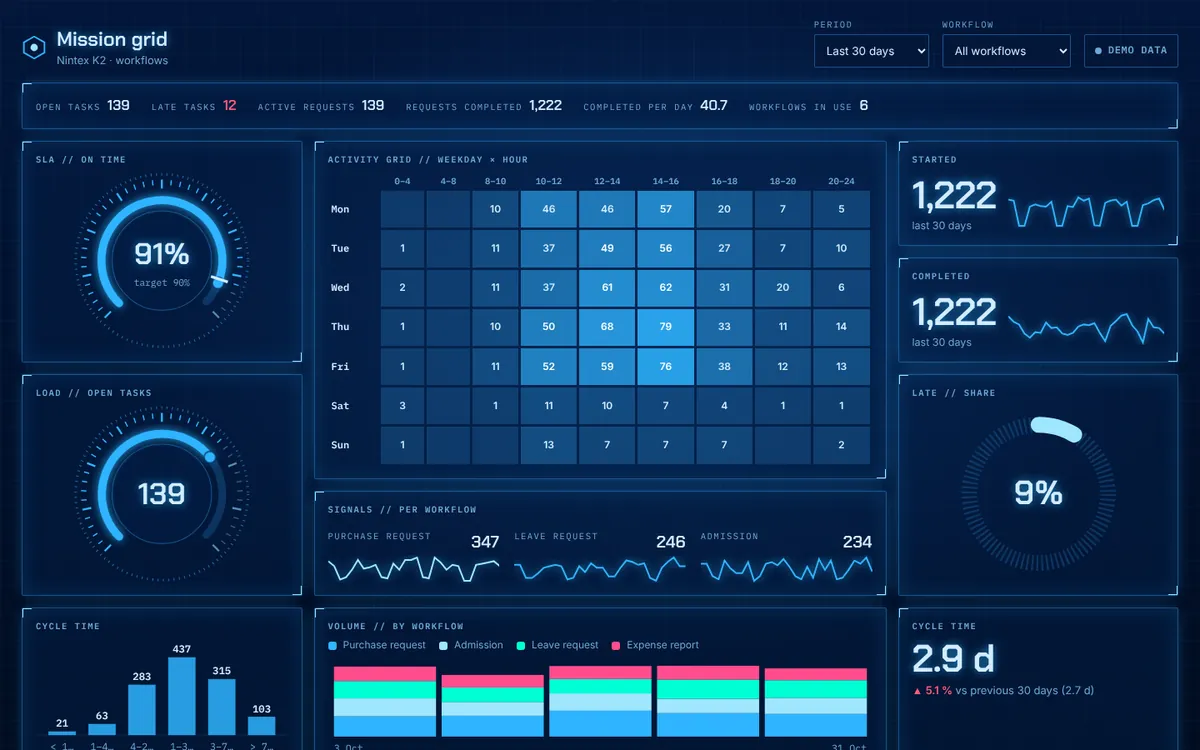
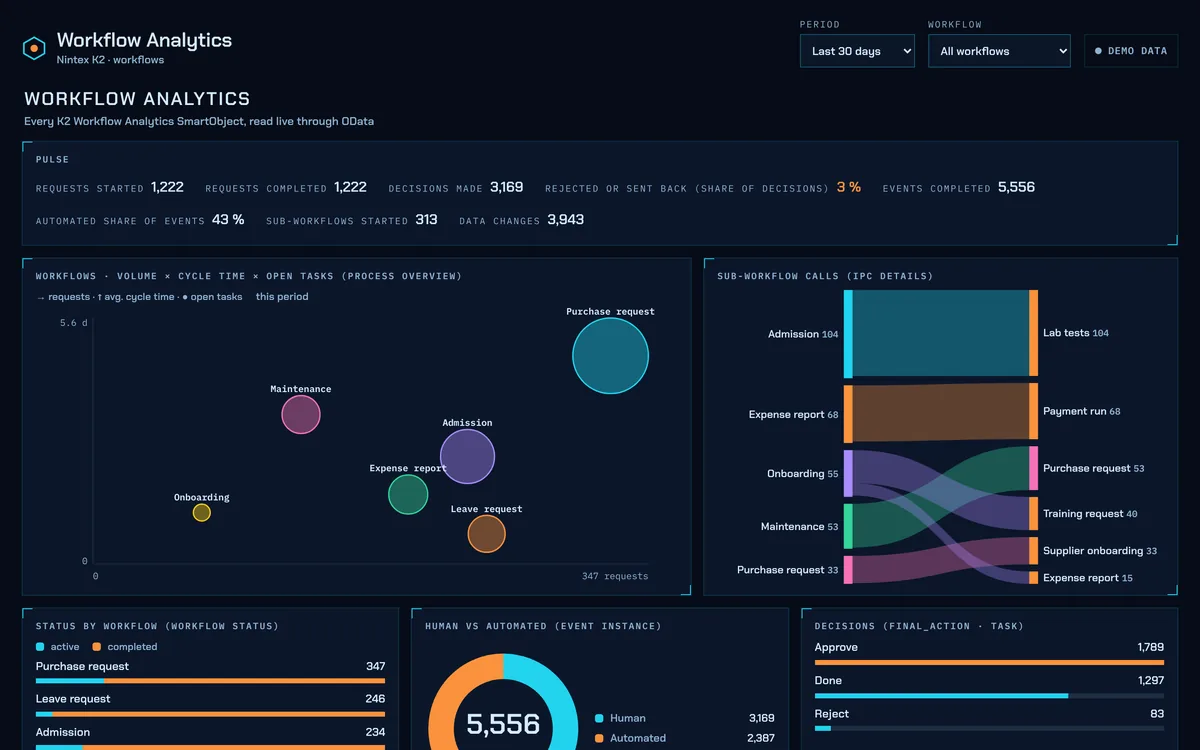
Pick the one closest to the question your readers ask, and to the screen they will use. Each template has its own theme; you can change the theme later without losing the blocks.
Up to 30 dashboards per account. Duplicate a dashboard from the list to start a variant.
03Arrange the blocks
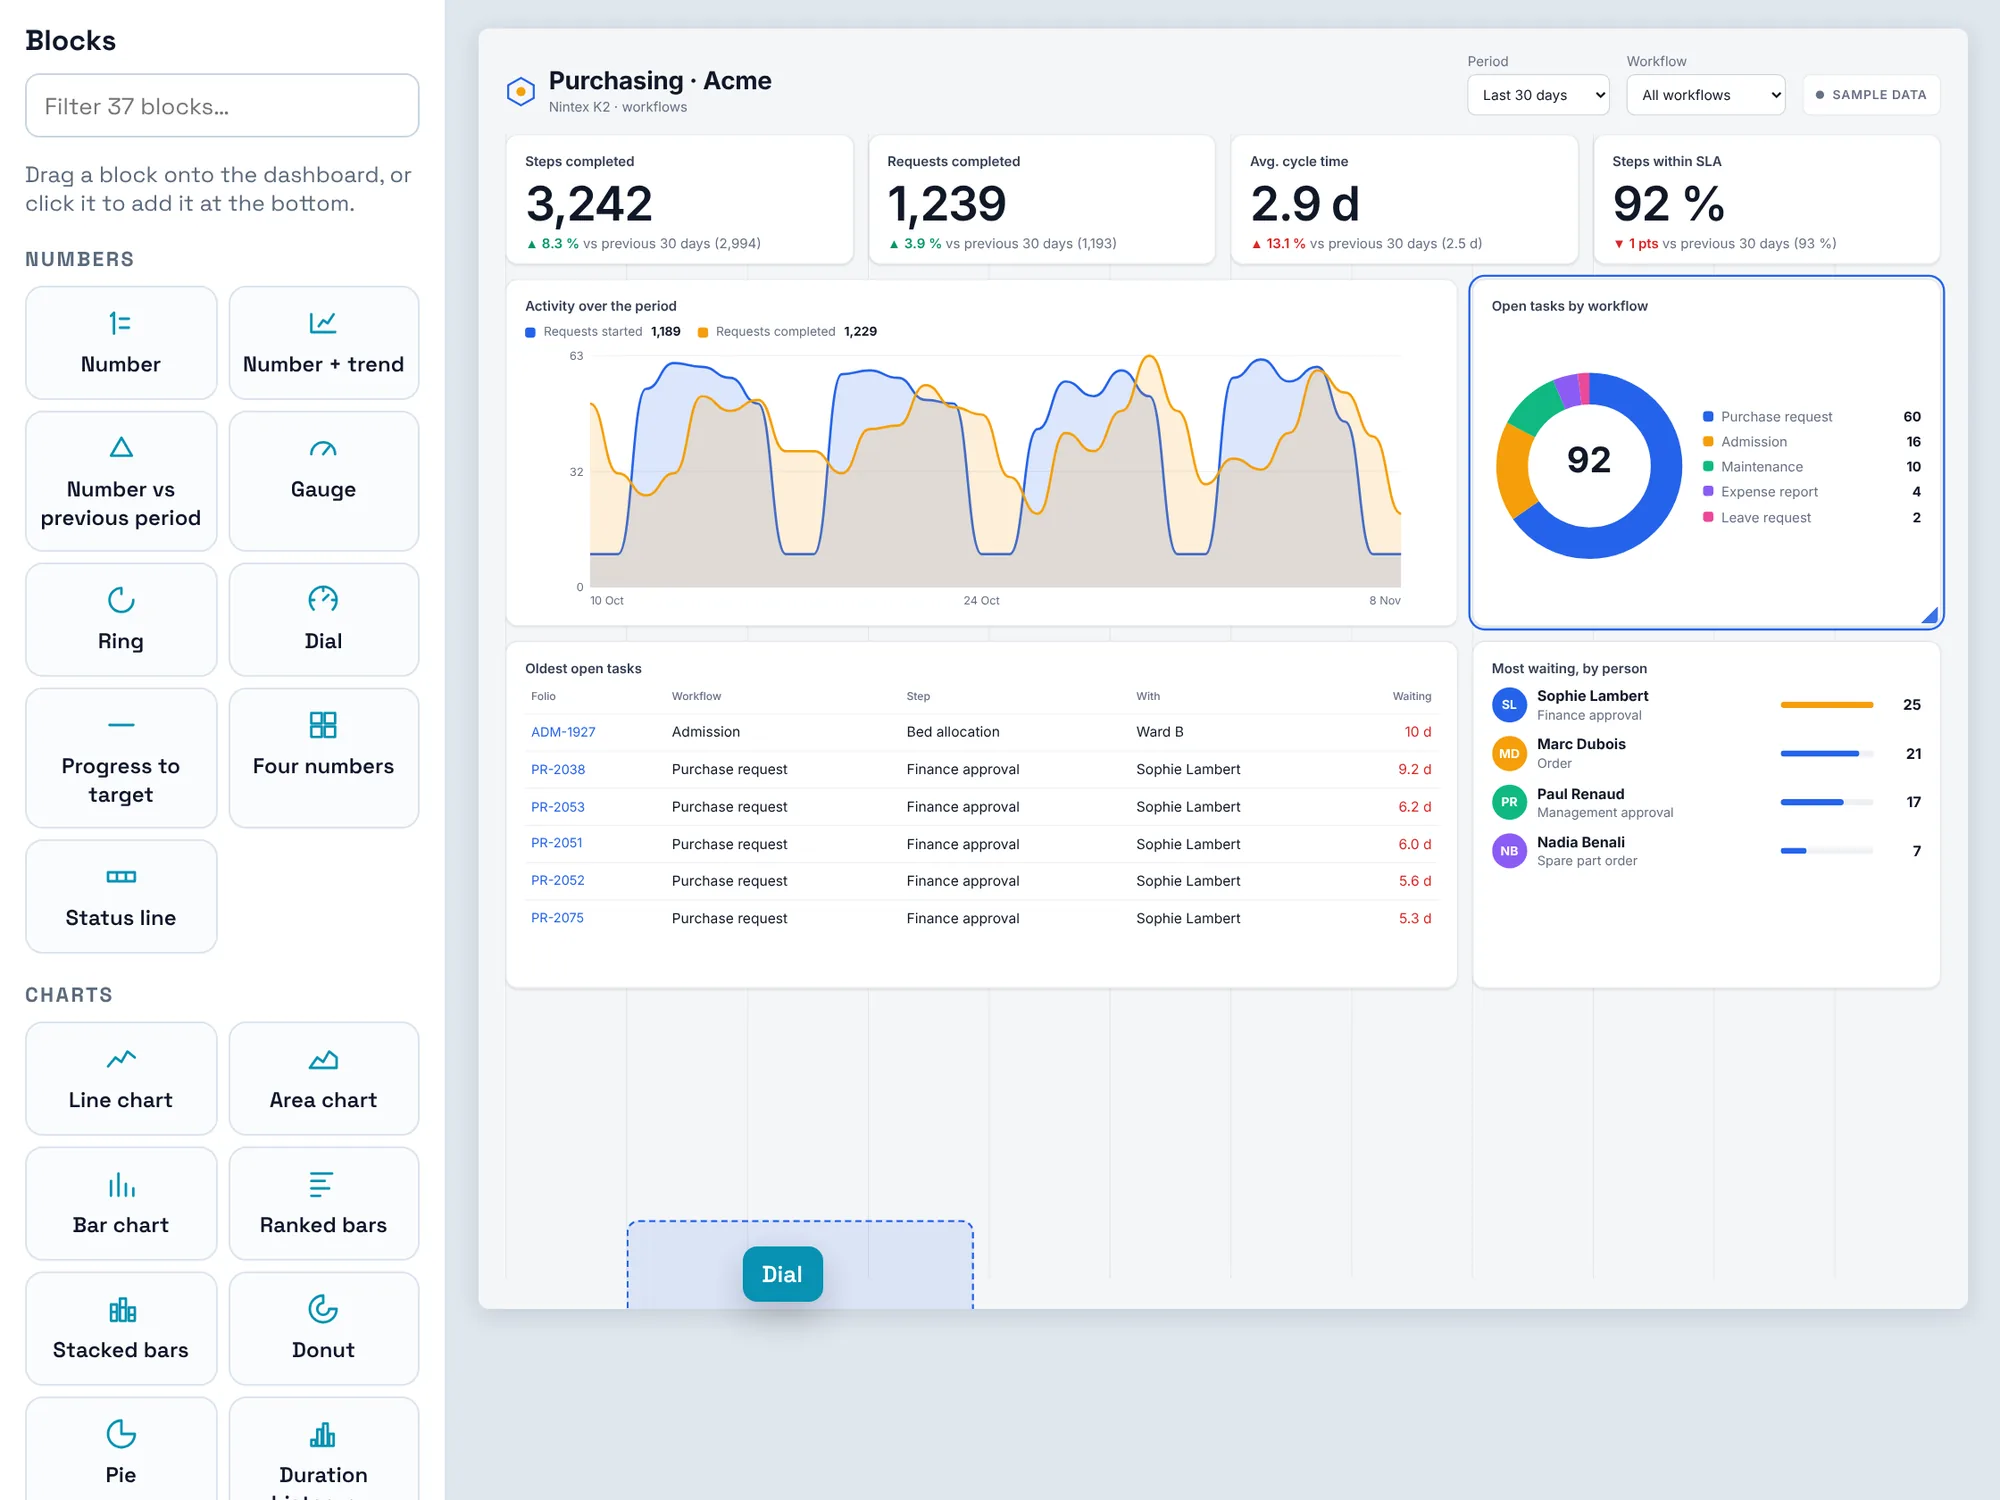
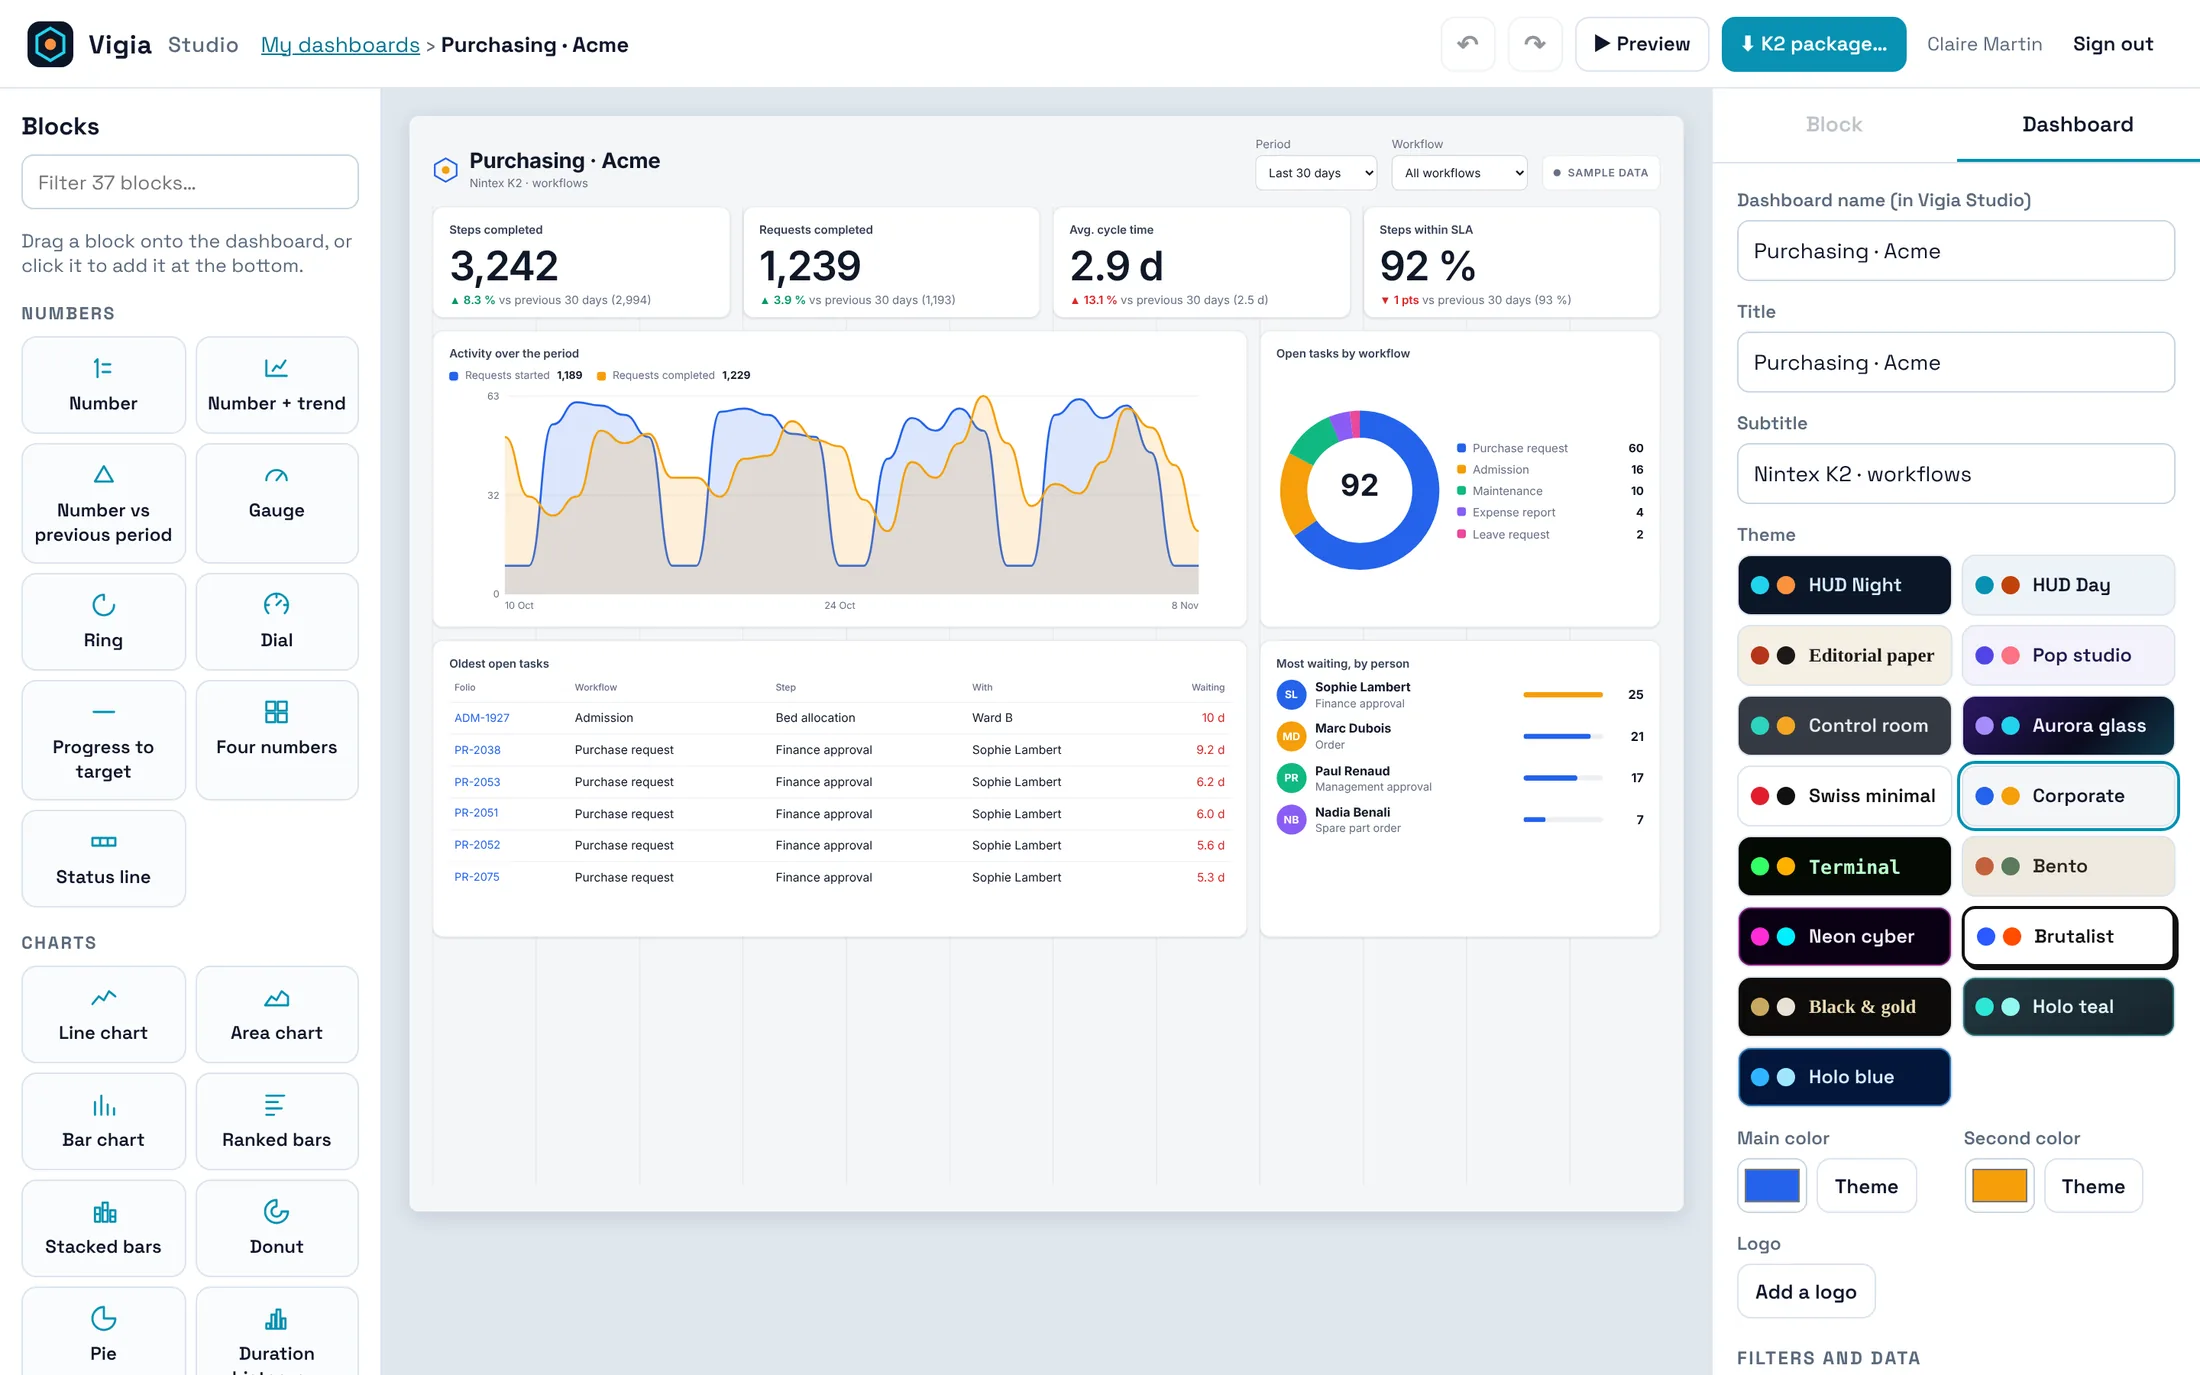 1234567
- 1Blocks: the palette, with a filter. 43 blocks in five families.
- 2Drag a block onto the dashboard, or click it to add it at the bottom.
- 3The dashboard, drawn at 1,440 px wide (a usual screen) and scaled to fit.
- 4A block: click to select it, drag to move it, drag its bottom-right corner to resize it.
- 5Block and Dashboard panels: the settings.
- 6Undo, redo and Preview (opens the dashboard alone, full screen).
- 7K2 package…: download the package to deploy.
The grid
The dashboard is a grid of 12 columns. A row is 56 px high, with 14 px between blocks. When you drop or resize a block, the blocks in the way move down, then everything settles upwards: there are no holes to fix by hand.
Keyboard
| Keys | Action |
|---|---|
| ← → ↑ ↓ | Move the selected block by one column or one row. |
| Delete / Backspace | Remove the selected block. |
| Ctrl Z (⌘ Z) | Undo. |
| Ctrl Shift Z | Redo. |
04Set up each block
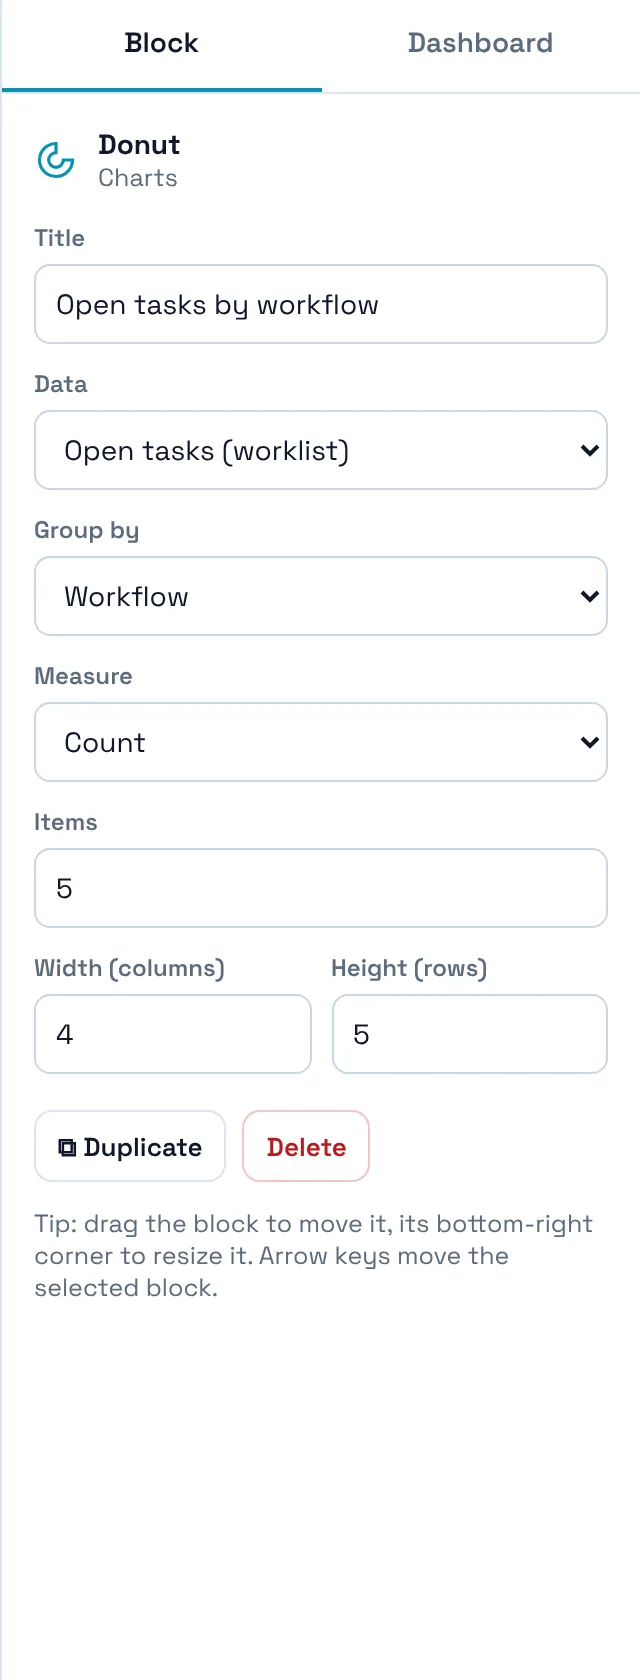
Select a block to see its settings. Every block has a title, a width (columns) and a height (rows), and the buttons Duplicate and Delete. The other fields depend on the block:
| Field | Choices |
|---|---|
| Value | One of the 19 values (next chapters): open tasks, cycle time, steps on time… |
| Data | Open tasks (worklist), requests (workflow instances), steps (activity history), decisions (completed tasks and their action), events (human and automated), data changes or sub-workflow calls. |
| Group by | Workflow, step, person, status, started by, waiting time, cycle time, step duration, weekday, hour, day, week, month (depending on the data). |
| Measure | Count, late count, average waiting time or average duration. |
| Items | How many bars, slices or rows; the rest is grouped as “others”. |
| Lines / Count | Requests started, requests completed, steps completed, tasks received; per day or per week. |
| Workflow | For the pipeline and the funnel: empty means the busiest workflow. |
| Target, maximum | For gauges, dials and progress bars. |
| Color | Leave “Theme color” to follow the theme, or pick a color for this block. |
05The 43 blocks
Default size in columns × rows. Every block can be resized.
| Block | What it shows | Size | |
|---|---|---|---|
| Numbers9 | |||
| Number | One key figure, with its period or a caption you write. | 3×2 | |
| Number + trend | A key figure with a small trend line of the period beside it. | 3×2 | |
| Number vs previous period | A figure compared with the previous period: arrow, percentage and previous value. Tick “Lower is better” for durations. | 3×2 | |
| Gauge | A half-circle gauge with an optional target mark. Best for percentages such as steps on time. | 3×3 | |
| Ring | A full ring with the value in the middle. Good for shares (late share, completed / started). | 3×3 | |
| Dial | A round dial with graduations that light up to the value, a marker and an optional target. | 3×4 | |
| Progress to target | A bar towards a target you set (for example 1,500 completed requests this month). | 4×2 | |
| Four numbers | Four small figures in one tile. | 4×3 | |
| Status line | A thin status line with up to eight figures across the full width. | 12×1 | |
| Charts15 | |||
| Line chart | Lines over time: requests started, completed, steps completed or tasks received, per day or per week. | 6×4 | |
| Area chart | The same as the line chart, with filled areas. | 6×4 | |
| Bar chart | Vertical bars grouped by any field: workflow, step, person, weekday, week, month… The largest bar uses the second color. | 4×4 | |
| Ranked bars | Horizontal ranked bars, the best way to compare names (workflows, steps, people). | 4×4 | |
| Stacked bars | Bars over time, split by workflow or by status. | 6×4 | |
| Donut | Shares of a whole, with the total in the middle and a legend. | 4×4 | |
| Pie | Shares of a whole, as a pie. | 3×4 | |
| Duration histogram | How long things take: requests, steps or the waiting time of open tasks, in duration bands. | 4×4 | |
| Weekday × hour | Weekday × hour of day: when requests start, when steps finish or when tasks arrive. | 6×4 | |
| Calendar | One square per day over several weeks, darker when more was done. | 6×3 | |
| Treemap | Rectangles sized by count, for example the open tasks of each person. | 4×4 | |
| Small multiples | One small trend per workflow, side by side, with its total. | 12×2 | |
| Ridge waves | One wave per workflow over 30 days, stacked like a relief. Each wave has its own scale (5-day average); the total is written next to the name. | 8×6 | |
| Workflow bubbles | One bubble per workflow: requests across, average cycle time up, open tasks as the size. Uses Process Overview when it is published, otherwise the period's requests. | 6×5 | |
| Data values | The latest value of one workflow data field in each request (Process Data Audit): total, average and spread for numbers, ranked values for text. | 4×4 | |
| Process6 | |||
| Step pipeline | The steps of one workflow in order: open requests per step, average time and the slowest step highlighted. | 12×3 | |
| Funnel | How many requests reach each step of a workflow. | 4×4 | |
| Workflow × waiting time | Workflows × waiting time of their open tasks (under 1 day, 1–3 days, 3–7 days, over 7 days). | 6×4 | |
| Status summary | Counts by status (requests, open tasks or steps) as coloured pills. | 4×2 | |
| Status by workflow | Each workflow's requests split by status in one bar (Workflow Status, or the period's requests). | 6×4 | |
| Sub-workflow map | Which workflow starts which sub-workflow, and how often (IPC Details). Band width = number of calls. When K2 gives only the calling workflow, the block ranks the workflows by sub-workflow calls. | 6×5 | |
| Lists7 | |||
| Table | A table of open tasks, requests or steps, sorted by oldest, newest or longest. | 6×4 | |
| People | People ranked by open tasks, late tasks or average waiting time. | 4×4 | |
| Live feed | The latest events: requests started and completed, steps done. | 4×4 | |
| My tasks | The tasks of the person who opens the dashboard, with a button to open each one in K2. | 4×4 | |
| Late tasks | Open tasks older than the late threshold, oldest first, with the person who has them. | 4×4 | |
| Team scorecard | One line per person: open tasks, late tasks, steps done and average step time (User Overview completes what the tasks show). | 6×5 | |
| Data changes | The latest changes of workflow data: field, new value, request and who changed it (Process Data Audit). | 4×4 | |
| Content6 | |||
| Title | A section title and subtitle, without a frame. | 6×1 | |
| Text | A short note for the readers. | 4×2 | |
| Image or logo | An image or a logo (PNG, JPEG, WebP, GIF or SVG, up to 300 KB), stored inside the K2 form. | 3×2 | |
| Date and time | The date and time. | 3×2 | |
| K2 links | Buttons that open K2 forms, by form name or address (for example “New purchase request”). | 4×2 | |
| Divider | An empty row, with or without a line, to separate sections. | 12×1 | |
Click to filter
In a deployed dashboard, and in the Preview, every bar, slice, bubble, cell, row and step can be clicked. The click filters all the other blocks; the block you clicked keeps all its values and shows yours highlighted.
- Same value everywhere. A workflow, a step or a person filters every block that has it.
- Linked by request. A block without that value keeps the requests concerned: click Reject in the decisions, and the requests, events, sub-workflows and data changes show only the rejected requests. Click a person, and you see the requests they worked on.
- One request. A row of a table, a late task or a line of the feed filters the whole dashboard to that request.
- Several filters add up. Each block holds one filter; filters from different blocks combine. They are listed under the header: click one to remove it, or Clear all. Click the highlighted item again, or press Esc.
- Numbers follow. Key figures, gauges and the status line are calculated on the filtered data. The period, workflow and person lists at the top still apply.
06The values
The values used by number, gauge, ring, dial and progress blocks. “Period: yes” means the value follows the period filter; the others describe the present.
| Value | Meaning | Data | Period |
|---|---|---|---|
| Open tasks | Tasks waiting in worklists right now. | Open tasks | — |
| Late tasks | Open tasks older than the late threshold (hours). | Open tasks | — |
| Late share of open tasks | Late tasks as a share of open tasks. | Open tasks | — |
| Avg. wait of open tasks | Average age of the open tasks. | Open tasks | — |
| Oldest open task | Age of the oldest open task. | Open tasks | — |
| People with open tasks | Number of people who have at least one open task. | Open tasks | — |
| My tasks | Tasks of the person who opens the dashboard (Workflow REST API). | My tasks | — |
| Active requests | Requests still running. | Requests | — |
| Requests started | Requests started during the period. | Requests | yes |
| Requests completed | Requests completed during the period. | Requests | yes |
| Completed / started | Completed divided by started, for the period. | Requests | yes |
| Requests in error | Requests in error. | Requests | — |
| Avg. cycle time | Average time from start to end of the requests completed in the period. | Requests | yes |
| Median cycle time | Median of the same cycle times (less sensitive to a few very long requests). | Requests | yes |
| Completed per day | Requests completed per day, on average, over the period. | Requests | yes |
| Workflows in use | Number of different workflows with requests. | Requests | — |
| Steps done within SLA | Share of the steps completed in the period that took less than the late threshold. | Steps | yes |
| Avg. step duration | Average duration of the steps completed in the period. | Steps | yes |
| Steps completed | Steps completed during the period. | Steps | yes |
| Decisions made | Tasks completed with an action (Approve, Reject…) during the period. | Decisions | yes |
| Rejected or sent back (share of decisions) | Share of those decisions that rejected or sent the request back. | Decisions | yes |
| Workflows deployed | Workflows deployed in the dashboard's folder (Process Set), or the workflows with requests. | Requests | — |
| Events completed | Events finished during the period, human and automated (Event Instance). | Events | yes |
| Automated share of events | Share of those events done by the K2 server, with no person (e-mails, updates, documents…). | Events | yes |
| Avg. automated event time | Average time of the automated events finished in the period. | Events | yes |
| Sub-workflows started | Sub-workflows started by another workflow during the period (IPC Details). | Sub-workflow calls | yes |
| Data changes | Changes of workflow data recorded during the period (Process Data Audit). | Data changes | yes |
| Data fields changed | Number of different data fields changed during the period. | Data changes | yes |
Duration bands
Waiting time of open tasks: under 1 day, 1–3 days, 3–7 days, over 7 days. Durations of requests and steps: under 1 hour, 1–4 hours, 4–24 hours, 1–3 days, 3–7 days, over 7 days.
07Dashboard settings
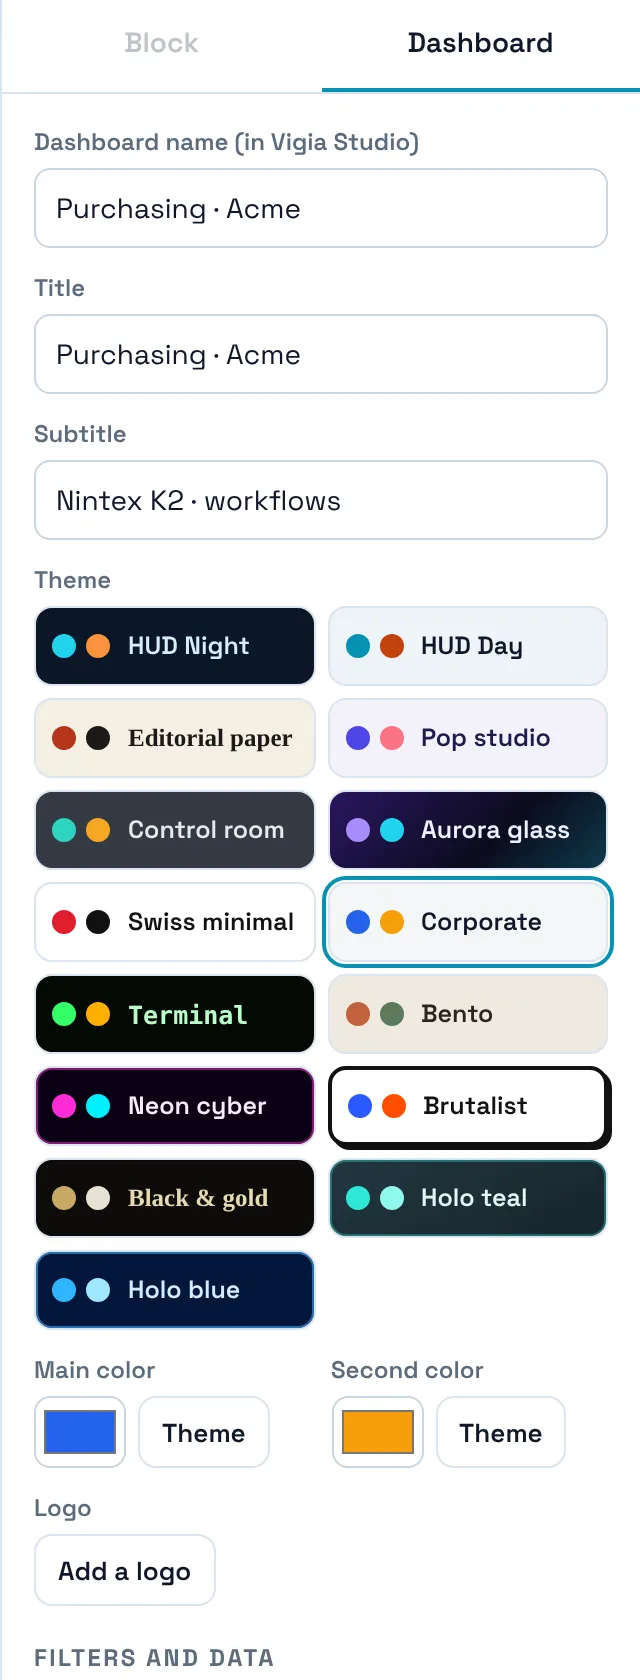
Look
- Dashboard name: the name in your list in the Studio.
- Title and subtitle: shown at the top of the dashboard, in K2.
- Theme: 15 themes. Changing it keeps the blocks and resets the two colors.
- Main color (lines, bars, rings) and second color (the largest bar, the first rank, the slowest step). Theme puts the theme's color back.
- Logo: shown next to the title. PNG, JPEG, WebP, GIF or SVG; it is stored inside the K2 form.
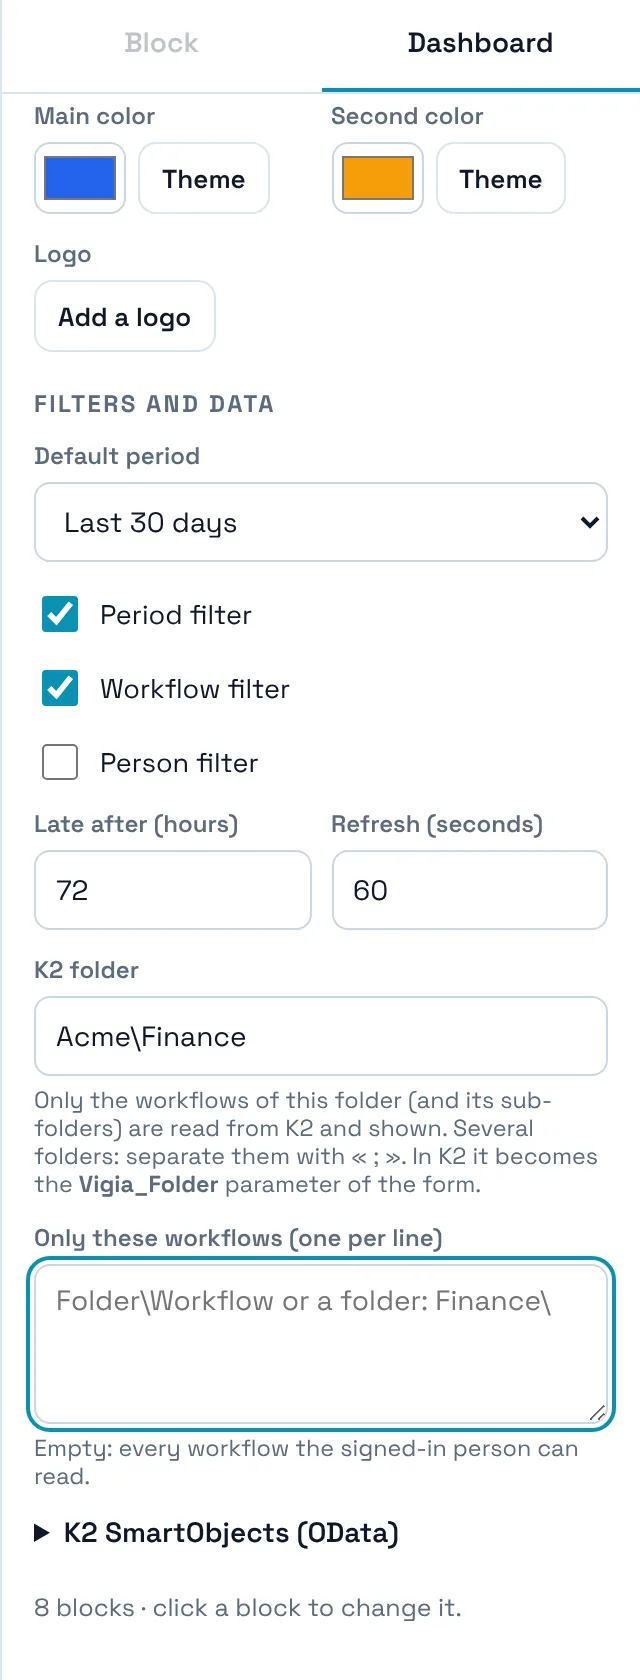
Filters and data
- Default period: 7, 30, 90 days or 12 months.
- Period, Workflow and Person filters: the lists readers get at the top of the dashboard.
- Late after (hours): the late threshold. Use your real service level (for example 48 hours).
- Refresh (seconds): how often the dashboard reads K2 again (15 seconds to 1 hour, 60 by default).
- K2 folder: only the workflows of this folder and its sub-folders are read and shown. Several folders: separate them with “;”. In K2 it becomes the
Vigia_Folderparameter. - Only these workflows: one workflow (Folder\Workflow) or folder per line, to narrow further.
- K2 SmartObjects (OData): the entity-set names, if Vigia does not find them by itself.
Company\Finance, an HR dashboard on Company\HR. Duplicate the dashboard and change the folder, or keep one package and change Vigia_Folder in K2 Designer.08Designing a good dashboard
A good dashboard answers one question in a few seconds. The Studio makes it easy to add blocks; the hard part is to leave some out.
Six rules
1 · Start from one question
“Where are purchase requests stuck?” is a dashboard. “Everything about K2” is not. Write the question in the subtitle.
2 · Key numbers first
People read from the top left. Put 3 or 4 numbers in the first row, 3 columns each, with their comparison or trend.
3 · Then the trend, then the detail
Middle rows: how it moves (line, area, bars per week). Bottom rows: what to act on (late tasks, oldest tasks, people).
4 · Six to twelve blocks
Beyond that, nobody reads the bottom. Make a second dashboard for another audience instead.
5 · Pick the theme for the screen
Dark themes for wall screens and big rooms, light themes for desks and printing, editorial themes for managers.
6 · Set the real thresholds
Late threshold, targets and maximums must match your service levels, or “late” and “on time” mean nothing.
Which block for which question
| Question | Blocks |
|---|---|
| How many, right now? | Number, Four numbers, Status line |
| Better or worse than before? | Number vs previous period, Number + trend |
| Are we on time? | Gauge, Dial, Ring with “Steps done within SLA” or “Late share” |
| Where are requests stuck? | Step pipeline, Funnel, Workflow × waiting time |
| Who has the most waiting? | People, Ranked bars by person, Treemap |
| When does the work arrive? | Weekday × hour, Calendar, Bar chart by weekday |
| How does each workflow move? | Small multiples, Ridge waves, Stacked bars |
| What must I do now? | Late tasks, My tasks, Table (oldest first) |
Three layouts to copy
Weekly management page
Theme: Editorial paper, Swiss minimal or Black & gold. Read once a week.
Operations wall screen
Theme: HUD Night, Holo teal or Control room. Seen from far away, all day.
Team board
Theme: Pop studio, Bento or Corporate. Opened by the team every morning.
Before you deploy
- Open Preview and read the dashboard as a newcomer would: is every title clear without explanation?
- Check the widths: numbers need 3 columns, charts 4 to 8, tables 6 or more.
- Deploy a Demo package first if the Workflow Reports SmartObjects are not published yet, to show the dashboard in K2.
09Deploy in K2
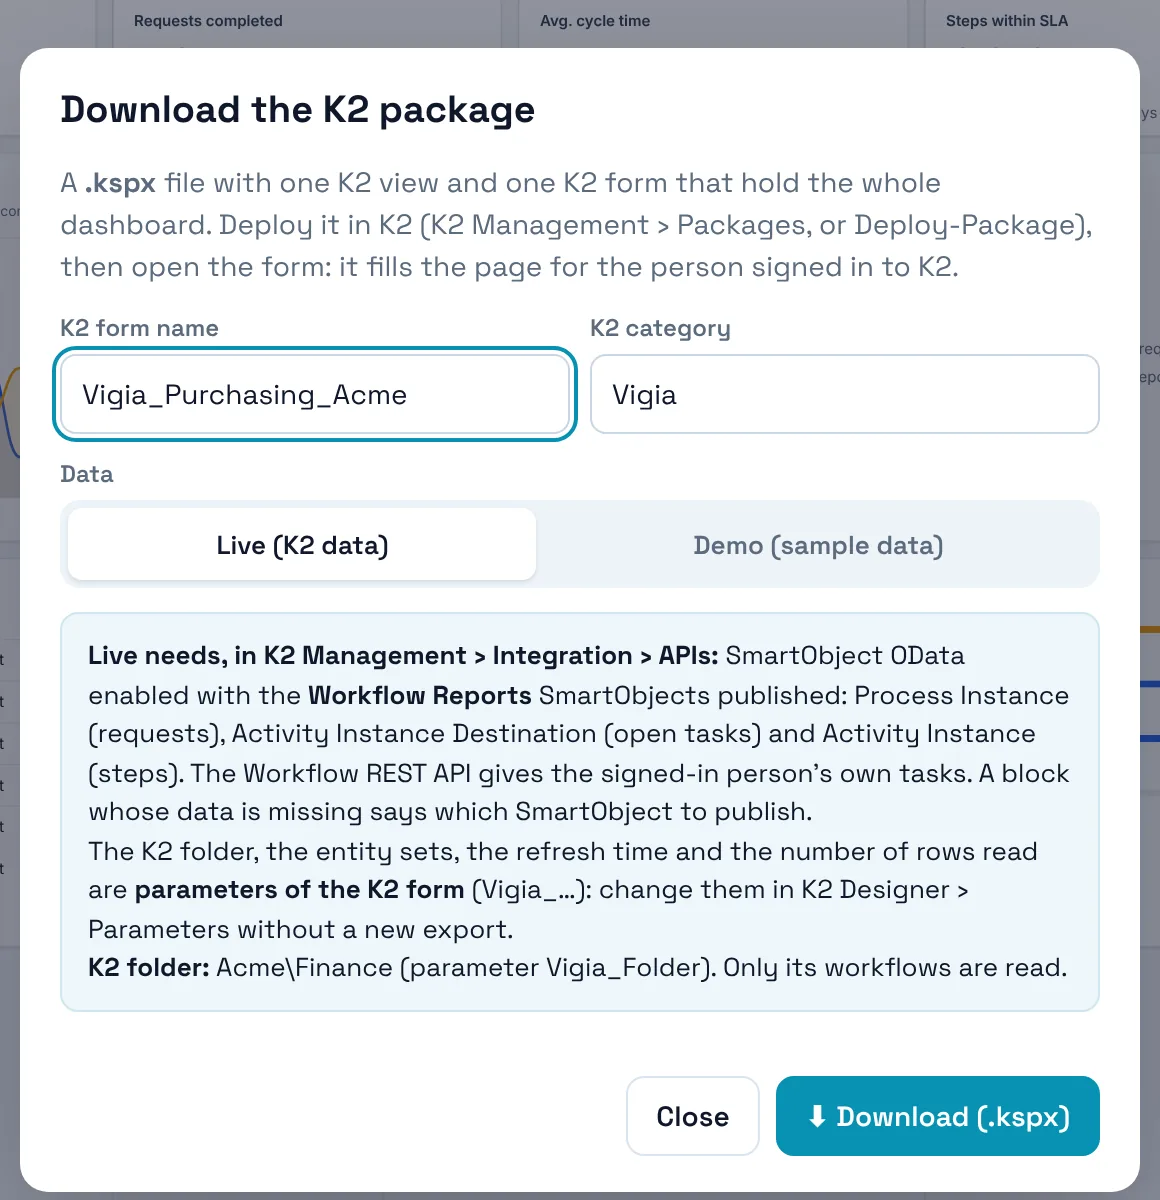
- Click K2 package… in the top bar.
- Check the K2 form name (letters, digits and _, for example
Vigia_Purchasing) and the K2 category. Use « / » for sub-categories:Vigia/Demoputs the form in the category Vigia › Demo. Both are kept in the dashboard (Dashboard settings › K2 form name, K2 category) and proposed again at the next export. - Choose Live (real K2 data) or Demo (sample data, to show the dashboard before the SmartObjects are published).
- Click Download (.kspx).
- In K2 Management › Packages, deploy the file.
- Open the form in K2: from K2 Designer, or at
/Runtime/Runtime/Form/<form name>/.
What the package contains
One K2 view and one K2 form, in the category you chose. The view holds three data labels you can read in K2 Designer: Vigia HTML, Vigia CSS (with the fonts) and Vigia JS (the engine and your dashboard). Deploying a new package of the same dashboard updates the view and the form in place.
Form parameters
Change them in K2 Designer › form › Parameters, without a new export.
| Parameter | Default | Use |
|---|---|---|
Vigia_Folder | The K2 folder set in the Studio | Only the workflows of this folder (and sub-folders) are read and shown, for example Demo 3D or Finance\Purchasing (a leading or trailing “/” or “\” is ignored). Several folders: separate them with “;”. It cannot be changed from the address bar. The folder appears under the dashboard title when it is applied. |
Vigia_OData_Instances | empty | Entity set of Process Instance. Empty: found automatically. |
Vigia_OData_Tasks | empty | Entity set of Activity Instance Destination (open tasks). |
Vigia_OData_Activities | empty | Entity set of Activity Instance (steps). |
Vigia_Refresh_Seconds | 60 | How often K2 is read again (15 at least). |
Vigia_Max_Rows | empty | No limit: K2 returns only the period chosen at the top of the dashboard. A number caps the rows read per SmartObject. |
10Data and security
- The data stays in K2. Once deployed, the form reads K2 from the browser of the person who opens it, with that person's own K2 session. No server in between, no copy elsewhere. The Studio only stores the layout of your dashboards.
- K2 permissions apply. Each reader sees what their K2 rights on the SmartObjects allow. Someone who cannot read the worklist SmartObject still sees their own tasks.
- The K2 folder is asked of K2 itself (
$filteron the workflow's full name). If K2 refuses that filter, the rows of other folders are dropped as soon as they arrive, before any calculation. - The period decides what is read. K2 returns what started, finished or changed during the period chosen at the top (7 days, 30 days, 90 days or 12 months) and the period before it (for the comparisons), plus everything still running. There is no row limit; Vigia follows K2's pages. Choosing another period reads K2 again.
11Troubleshooting
| You see | Why | What to do |
|---|---|---|
| “The K2 OData API does not answer” | SmartObject OData is not enabled. | Enable it in K2 Management › Integration › APIs. |
| “No Process Instance SmartObject published in OData” | The SmartObject is not published, or has another name. | Publish it, or give its entity-set name in Vigia_OData_Instances. |
| Status “K2 · data missing” | None of the three SmartObjects could be read. | Hover the status to read the reason of each one. |
| Notes say “your tasks” instead of “right now” | The worklist SmartObject is not readable: the person's own tasks are used instead. | Publish Activity Instance Destination, or give its name in Vigia_OData_Tasks. |
| “Your K2 tasks are not readable” | The Workflow REST API is off. | Enable it in K2 Management › Integration › APIs. |
| Empty dashboard after setting a K2 folder | The folder does not match the full workflow names. | Use the folder path as K2 shows it (for example Company\Finance); case does not matter. |
| Totals seem too low on long periods | Vigia_Max_Rows is filled in and caps the rows read. | Empty Vigia_Max_Rows in K2 Designer › Parameters. |
| Studio changes are not in K2 | K2 runs the last package deployed. | Download the package again and deploy it. |
| “Vigia could not start” | A data label of the view was changed or removed. | Deploy the package again. |